. 2009 Jun 9;106(23):9419-24.
doi: 10.1073/pnas.0902534106. Epub 2009 May 27.

Neural deficits contribute to respiratory insufficiency in Pompe disease

Affiliations

Neural deficits contribute to respiratory insufficiency in Pompe disease

Lara R DeRuisseau et al. Proc Natl Acad Sci U S A. .

Abstract

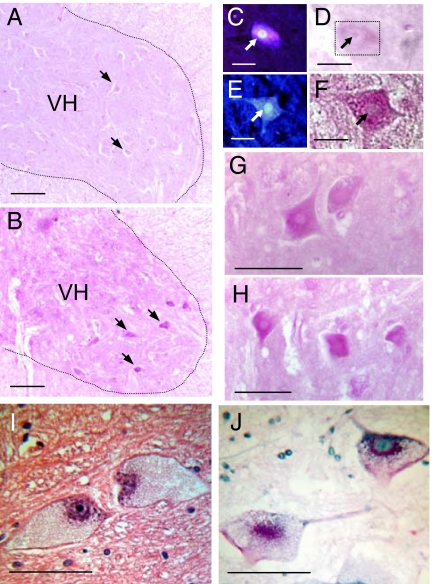
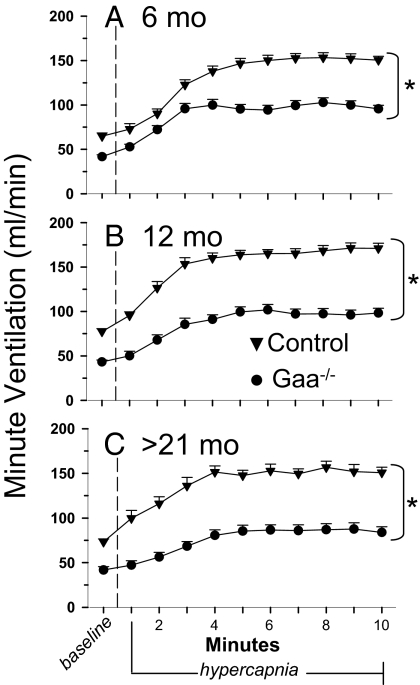
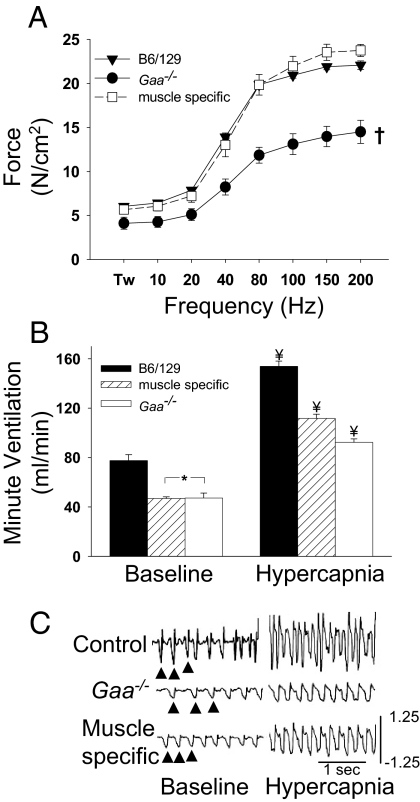
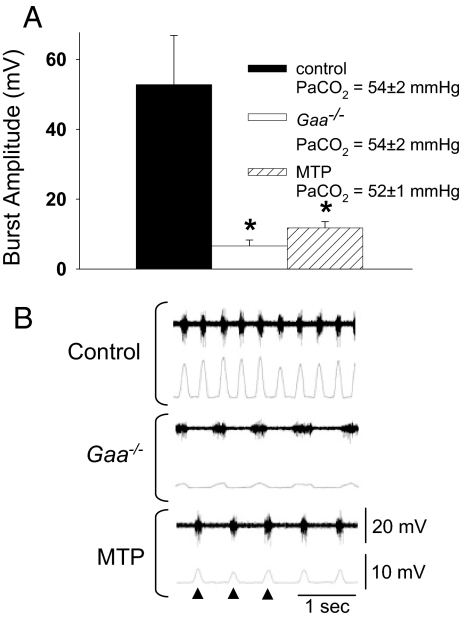
Pompe disease is a severe form of muscular dystrophy due to glycogen accumulation in all tissues, especially striated muscle. Disease severity is directly related to the deficiency of acid alpha-glucosidase (GAA), which degrades glycogen in the lysosome. Respiratory dysfunction is a hallmark of the disease, muscle weakness has been viewed as the underlying cause, and the possibility of an associated neural contribution has not been evaluated previously. Therefore, we examined behavioral and neurophysiological aspects of breathing in 2 animal models of Pompe disease--the Gaa(-/-) mouse and a transgenic line (MTP) expressing GAA only in skeletal muscle, as well as a detailed analysis of the CNS in a Pompe disease patient. Glycogen content was elevated in the Gaa(-/-) mouse cervical spinal cord. Retrograde labeling of phrenic motoneurons showed significantly greater soma size in Gaa(-/-) mice vs. isogenic controls, and glycogen was observed in Gaa(-/-) phrenic motoneurons. Ventilation, assessed via plethysmography, was attenuated during quiet breathing and hypercapnic challenge in Gaa(-/-) mice (6 to >21 months of age) vs. controls. We confirmed that MTP mice had normal diaphragmatic contractile properties; however, MTP mice had ventilation similar to the Gaa(-/-) mice during quiet breathing. Neurophysiological recordings indicated that efferent phrenic nerve inspiratory burst amplitudes were substantially lower in Gaa(-/-) and MTP mice vs. controls. In human samples, we demonstrated similar pathology in the cervical spinal cord and greater accumulation of glycogen in spinal cord compared with brain. We conclude that neural output to the diaphragm is deficient in Gaa(-/-) mice, and therapies targeting muscle alone may be ineffective in Pompe disease.


Conflict of interest statement

Conflict of interest statement: B.J.B., The Johns Hopkins University, and the University of Florida could be entitled to patent royalties for inventions described in this manuscript.

Figures

Fig. 1.
Fig. 1.
Cervical spinal cord histology in B6/129 and Gaa−/− mice as well as a Pompe patient. (A and B) The C4 ventral horn (VH) of a control B6/129 mouse (A) and a Gaa−/− mouse (B). Arrows indicate neuronal cell bodies. Positive staining for glycogen reaction product (PAS stain; pink) was virtually absent in the control cord (A) compared with the Gaa−/− cord (B). Putative motoneuron cell bodies showed PAS reaction product in Gaa−/− spinal cords (e.g., arrows in B), and therefore additional experiments were conducted to retrogradely label phrenic motoneurons before PAS staining. (C and D) Fluorogold labeling (C) and PAS staining (D) of the same cell in a control mouse. The PAS stain is very light in this control tissue, and therefore the box in D outlines the same phrenic motoneuron fluorescently labeled in C (arrows point to nucleus). (E and F) Fluorogold (E) and PAS staining (F) in a Gaa−/− phrenic motoneuron. (G and H) Additional examples of PAS-positive neurons observed in the VH of the C4 spinal cord of Gaa−/− mice. Tissue was also obtained from the VH of the cervical spinal cord of a Pompe patient (see Materials and Methods) and stained with hematoxylin and eosin (I) and PAS (J). Pompe neurons in the ventral cervical horn had a swollen cell body with a nucleus located in an eccentric position within the cell soma (I). PAS staining indicates glycogen accumulation within the cell soma (J). (Scale bars: A and B, 100 μm; C–F, 20 μm; G–J, 50 μm.)
Fig. 2.
Fig. 2.
Ventilation measured with whole-body plethysmography in B6/129 and Gaa−/−mice. Minute ventilation (mLs per minute) was measured during quiet breathing (i.e., baseline, 21% O2, balance N2), followed by a 10-min hypercapnic challenge (7% CO2, balance O2). A–C Data from B6/129 control (▾) and Gaa−/− mice (●) of different ages: 6 months (A), 12 months (B), and >21 months (C). *, Control response is different from Gaa−/− response, P < 0.01.
Fig. 3.
Fig. 3.
Diaphragm contractility and ventilation in muscle-specific hGaa mice. (A) In vitro diaphragm contractility data for B6/129 (▾), Gaa−/− (●), and muscle-specific hGaa mice (□). Over a broad range of stimulation frequencies (Hz), the force developed by the muscle-specific hGaa diaphragm was similar to the B6/129 diaphragm (Tw = twitch force). Minute ventilation during baseline conditions was similar between muscle-specific and Gaa−/− mice (B). However, during a hypercapnic challenge (B), muscle-specific mice achieved ventilation that was greater than Gaa−/− mice but still less than B6/129 mice. Representative airflow tracings from unanesthetized mice during quiet breathing (baseline) and respiratory challenge (hypercapnia) are provided in C (arrows indicate breaths). The scaling is identical in all panels, and airflow calibration is in milliliters per second. *, Data are different from corresponding B6/129 data points; ¥, all groups are different from each other; †, Gaa−/− data are different from control and muscle-specific hGaa data (P < 0.01).
Fig. 4.
Fig. 4.
Phrenic inspiratory burst amplitude recorded in anesthetized mice. The amplitude of the rectified and integrated phrenic inspiratory burst (see Materials and Methods) was quantified in control B6/129, Gaa−/−, and muscle-specific hGaa mice during spontaneous breathing with similar arterial PaCO2 values (A). *, Different from control, P < 0.01. Typical examples of the unprocessed or “raw” phrenic neurogram (top traces) and the rectified, integrated neurogram (bottom traces) are shown in B (arrows indicate neural breaths). Scaling is identical between the 3 examples.

Similar articles

Cited by

References

    1. Brown AM, Baltan Tekkök S, Ransom BR. Energy transfer from astrocytes to axons: The role of CNS glycogen. Neurochem Int. 2004;45:529–536. - PubMed
    1. Vilchez D, et al. Mechanism suppressing glycogen synthesis in neurons and its demise in progressive myoclonus epilepsy. Nat Neurosci. 2007;10:1407–1413. - PubMed
    1. Sidman RL, et al. Temporal neuropathologic and behavioral phenotype of 6neo/6neo Pompe disease mice. J Neuropathol Exp Neurol. 2008;67:803–818. - PMC - PubMed
    1. Hirschhorn R, Reuser AJJ. Glycogen storage disease type II; acid α-glucosidase (acid maltase) deficiency. In: Scriver CR, Beaudet AL, Sly WS, Valle D, editors. The Metabolic and Molecular Basis of Inherited Disease. 8th Ed. New York: McGraw-Hill; 2001. Chapter 135.
    1. Lejeune N, Thines-Sempoux D, Hers HG. Tissue fractionation studies. 16. Intracellular distribution and properties of alpha-glucosidases in rat liver. Biochem J. 1963;86:16–21. - PMC - PubMed

Publication types

Substances