. 2009 May 27;29(21):6904-16.
doi: 10.1523/JNEUROSCI.1585-09.2009.

Lineage and birth date specify motor neuron targeting and dendritic architecture in adult Drosophila

Affiliations

Lineage and birth date specify motor neuron targeting and dendritic architecture in adult Drosophila

Myungin Baek et al. J Neurosci. .

Abstract

Locomotion in adult Drosophila depends on motor neurons that target a set of multifibered muscles in the appendages. Here, we describe the development of motor neurons in adult Drosophila, focusing on those that target the legs. Leg motor neurons are born from at least 11 neuroblast lineages, but two lineages generate the majority of these cells. Using genetic single-cell labeling methods, we analyze the birth order, muscle targeting, and dendritic arbors for most of the leg motor neurons. Our results reveal that each leg motor neuron is born at a characteristic time of development, from a specific lineage, and has a stereotyped dendritic architecture. Motor axons that target a particular leg segment or muscle have similar dendritic arbors but can derive from different lineages. Thus, although Drosophila uses a lineage-based method to generate leg motor neurons, individual lineages are not dedicated to generate neurons that target a single leg segment or muscle type.


Figures

Figure 1.
Figure 1.
Vglut–Gal4 and MHC–GFP expression patterns. A, Adult legs of Vglut–Gal4; UAS–CD8GFP animals imaged for GFP fluorescence. A′ is a medial view; A″ is a lateral view. B, Adult legs of MHC–tauGFP animals imaged for GFP fluorescence. B′ is a medial view; B″ is a lateral view. The muscles are labeled as described previously (Soler et al., 2004). C, Higher-magnification views of the individual leg segments from Vglut–Gal4; UAS–CD8GFP animals. Individual muscles are shown and color-coded as follows: levator muscles, turquoise; depressor muscles, blue; reductor muscles, pink; long tendon muscles, yellow. In the tibia (C″″), several sensory neuron cell bodies are also labeled by Vglut–Gal4 (indicated by the *). Co, Coxa; Tr, trochanter; Fe, femur; Ti, tibia; Ta, tarsus; trlm, trochanter levator muscle; trdm, trochanter depressor muscle; trrm, trochanter reductor muscle; fedm, femur depressor muscle; ferm, femur reductor muscle; ltm2; long tendon muscle 2; tilm, tibia levator muscle; tidm, tibia depressor muscle; tirm, tibia reductor muscle; ltm1, long tendon muscle 1; talm, tarsus levator muscle; tadm, tarsus depressor muscle; tarm, tarsus reductor muscle (Soler et al., 2004). D, CNS preparations from adult Vglut–Gal4; UAS–CD8GFP flies imaged for GFP fluorescence. D′ shows the thoracic and abdominal ganglia; D″ shows a higher magnification of the T1 portion of the thoracic ganglia. The T1 neuromeres are outlined by the blue dotted circles. D‴ shows a lower-intensity version of the image in D″ to better visualize the labeled cell bodies that lie immediately anterior and posterior to the neuromere (arrows). Some interneurons along the midline (indicated by the vertical blue dotted line in D″) are also labeled by Vglut–Gal4.
Figure 2.
Figure 2.
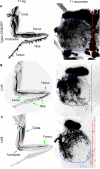
Leg motor neurons born from lineages A and B. A, Dissected leg (left) and T1 neuromere (right; outlined in blue) from a Vglut–Gal4; UAS–CD8GFP adult. Individual leg segments are labeled. The blue asterisks (*) indicate the cell bodies of sensory neurons that are also labeled by this driver. The neuromere images in A–C are projections of the entire Z-stack along the dorsoventral axis. B, Dissected leg (left) and T1 neuromere (right; outlined in blue) from an animal containing a positively marked Lin A clone that labels axons in the femur and tibia (arrows). The purple asterisk indicates a non-Lin A motor neuron that was also labeled in this sample. C, Dissected leg (left) and T1 neuromere (right; outlined in blue) from an animal containing a positively marked Lin B clone, which labels axons in the coxa, trochanter, and femur (arrows).
Figure 3.
Figure 3.
Reproducibility of dendrite and axon arbors. A, B, Three examples of the same Lin B-derived motor neuron (Co4; A) and the same Lin A-derived motor neuron (Fe3; B) showing very similar dendritic (left images) and axon (right images) arbors. The schematics above the images indicate the imaged leg segment (red boxes). The purple asterisks indicate sensory neurons that were also labeled in these experiments. The neuromere images are projections of the entire dorsoventral axis Z-stack. A subset of Lin A–Fe3 dendrites extend across the midline (B, arrows). The midlines of the CNSs are indicated by the red dotted lines. C–E, Three examples of samples that had the identical motor neuron labeled on the left and right sides of the same animal. In each case, both the left (L) and right (R) neuromeres (left panels) and legs (right panels) are shown. The schematics above the images indicate the imaged leg segment (red boxes). C, Lin B–Co3; D, Lin A–Fe7; E, Lin A–Ti11. Purple asterisks indicate sensory neurons that were also labeled in these images. The midlines of the CNSs are indicated by the red dotted lines.
Figure 4.
Figure 4.
Representative Lineage A motor neurons. A–F, Representative Lin A motor neurons that target the tibia. In all cases, the dendrites in the neuromere (a compression of the entire dorsoventral stack), the axon in the leg, and a schematic of the leg segment and axon are shown. The midlines of the CNSs are shown by the red dotted lines. Ti1 (A) and Ti2 (B) target the distal part of the long tendon muscle 1 (ltm1; schematized in yellow), and Ti6 (C) and Ti8 (D) target the proximal part of the same muscle. Note that Ti2, Ti6, and Ti8, which all target ltm1, all have midline-crossing dendrites (arrows). Ti10 and Ti12 target the tarsal levator (talm) and tarsal depressor (tadm), respectively. Red asterisks indicate sensory neurons. G–L, Representative Lin A motor neurons that target the femur. Note that Fe3 (H), which targets ltm2, has midline-crossing dendrites. Fe1 and Fe4 target the tibia depressor (tidm), and Fe8, Fe9, and Fe10 target the tibia reductor (tirm). For examples of all 27 of the 28 Lin A motor neurons that have been labeled as single cells, see supplemental Figures 2 and 3 (available at www.jneurosci.org as supplemental material).
Figure 5.
Figure 5.
Lineage B motor neurons. A–G, Representative examples of all seven Lin B motor neurons. A–D (Co1 to Co4) project to the coxa, E and F (Tr1, Tr2) project to the trochanter, and G (Fe1) projects to the femur. Images and labeling are the same as for Figure 4. Four motor neurons (Lin B–Co1–4; A–D) target the trochanter levator muscle in the coxa (trlm). In the trochanter, Lin B–Tr1 targets the femur reductor muscle (ferm; E) and the femur depressor muscle (fedm). Lin B–Tr2 targets the femur depressor muscle (fedm; F). In the femur, a single Lin B motor neuron, Fe1 (G), targets both the tibia depressor muscle (tidm) and the tibia reductor muscle (tirm). Midlines in the CNS images are indicated by the red dotted lines.
Figure 6.
Figure 6.
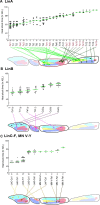
Relationships between birth date and muscle targeting. A–C, The birth dates (h AEL) and muscle targets are plotted for 27 Lin A (A), 7 Lin B (B), or 10 other (C) motor neurons that have been individually labeled. Each black dot represents a unique single-cell clone for that motor neuron, and the green bars represent the median birth date. Motor neurons are ordered along the x-axis according to median birth date. The number of samples for each individually labeled motor neuron immediately follows its name. For neurons that were only rarely labeled (e.g., Lin A Fe10), birth dates are tentative. For Lin A (A), motor neuron names are red or black, depending on if they project to the femur or tibia, respectively. Also for Lin A (A), the lines going to the muscles are colored light or dark green for motor neurons born during the first or second halves, respectively, of the time window when motor neurons are being generated by this lineage.
Figure 7.
Figure 7.
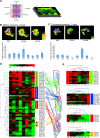
Relationships between dendritic pattern and muscle targeting. A, Scheme for collecting eight sector data for dendrite occupancy in the T1 neuromere. The image on the right is a projection of ∼40 confocal slices along the dorsoventral axis of the T1 neuromere. The cylinder on the left schematizes the three-dimensional T1 neuromere. Three axes are labeled: lateromedial, anteroposterior, and dorsoventral. The cylinder was divided into eight sectors (D1, D2, D3, D4, V1, V2, V3, V4) as indicated. For each labeled dendrite, the dorsal and ventral halves consisted of ∼20 confocal sections. B, C, Examples of unique dendritic architectures within the T1 neuromere. The three images show heat maps quantifying the extent of overlap of the dendrites for the midline-crossing motor neurons (B) and the trochanter-targeting motor neurons (C). The scales shown on the bottom right of each panel range from 100% overlap (blue) to no overlap (green; only a single dendrite is present). Heat maps were generated using confocal projections for all (total), dorsal, or ventral sections as indicated. The bar graphs below the images show the amount of dendrite representation for each set of neurons for all eight sectors; dendrite representations are expressed relative to the average for all motor neurons. The error bars are SDs. The dendrites of the midline-crossing neurons (B) are overrepresented in sector D4, whereas those of the trochanter-targeting neurons (C) are underrepresented in V4 and D4 and overrepresented in V2. Supplemental Figure 6 (available at www.jneurosci.org as supplemental material) presents analyses of dendrite organization for other related groups of motor neurons. D, Dendrogram and heat map analysis of the eight sector data. For each motor neuron, each sector was given a dendritic representation score relative to the average representation for all 47 motor neurons. The figure color codes these scores, ranging from ≤0.1× relative to the average (green) to ≥2× relative to the average (red). Black is equivalent to the average (1×). Motor neurons were clustered according to the similarities in their eight sector data using MeV (http://www.tm4.org/mev.html). Groups of motor neurons that cluster together are shown on the right, and their muscle targets in the legs are schematized. E, For each of the four sets of motor neurons that clustered together in (D), the columns (sectors) were clustered according to their similarities. Different sectors group together in the different sets of motor neurons, suggesting that each set of motor neurons has a unique dendritic organization.

References

    1. Bässler U, Büschges A. Pattern generation for stick insect walking movements: multisensory control of a locomotor program. Brain Res Brain Res Rev. 1998;27:65–88. - PubMed
    1. Bhat KM. Cell-cell signaling during neurogenesis: some answers and many questions. Int J Dev Biol. 1998;42:127–139. - PubMed
    1. Broadus J, Skeath JB, Spana EP, Bossing T, Technau G, Doe CQ. New neuroblast markers and the origin of the aCC/pCC neurons in the Drosophila central nervous system. Mech Dev. 1995;53:393–402. - PubMed
    1. Brody T, Odenwald WF. Regulation of temporal identities during Drosophila neuroblast lineage development. Curr Opin Cell Biol. 2005;17:672–675. - PubMed
    1. Burrows M. Local circuits for the control of leg movements in an insect. Trends Neurosci. 1992;15:226–232. - PubMed

Publication types

MeSH terms

LinkOut - more resources