. 2009 May 27;29(21):7053-64.
doi: 10.1523/JNEUROSCI.1357-08.2009.

Cerebral activity during the anesthesia-like state induced by mesopontine microinjection of pentobarbital

Affiliations

Cerebral activity during the anesthesia-like state induced by mesopontine microinjection of pentobarbital

Ruth Abulafia et al. J Neurosci. .

Abstract

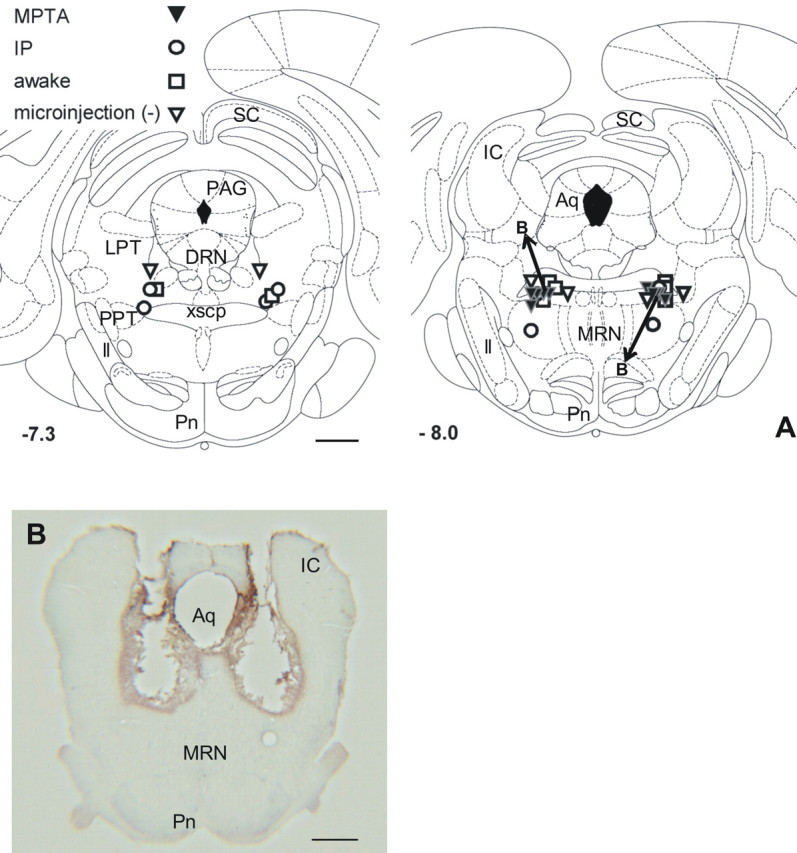
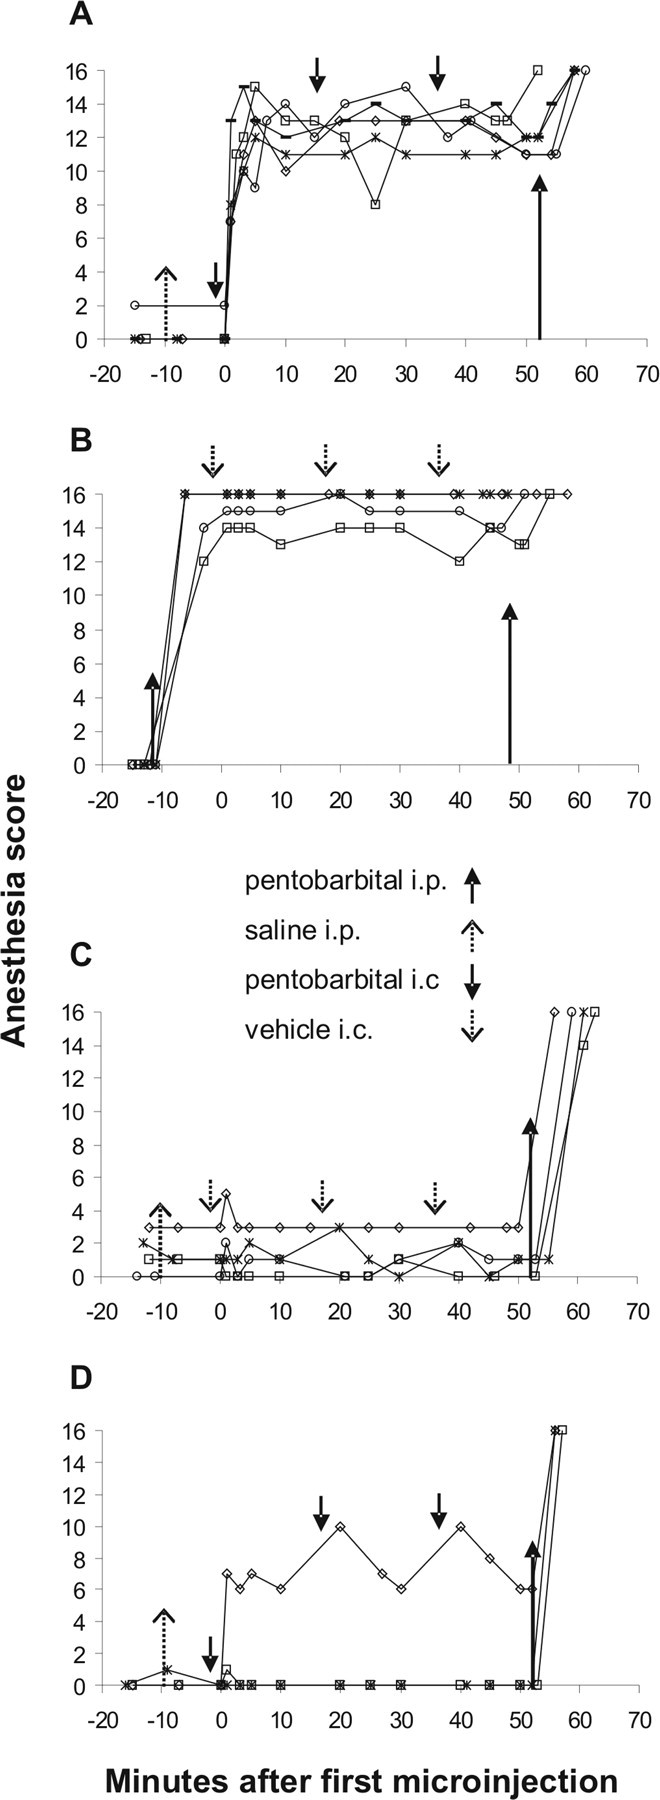
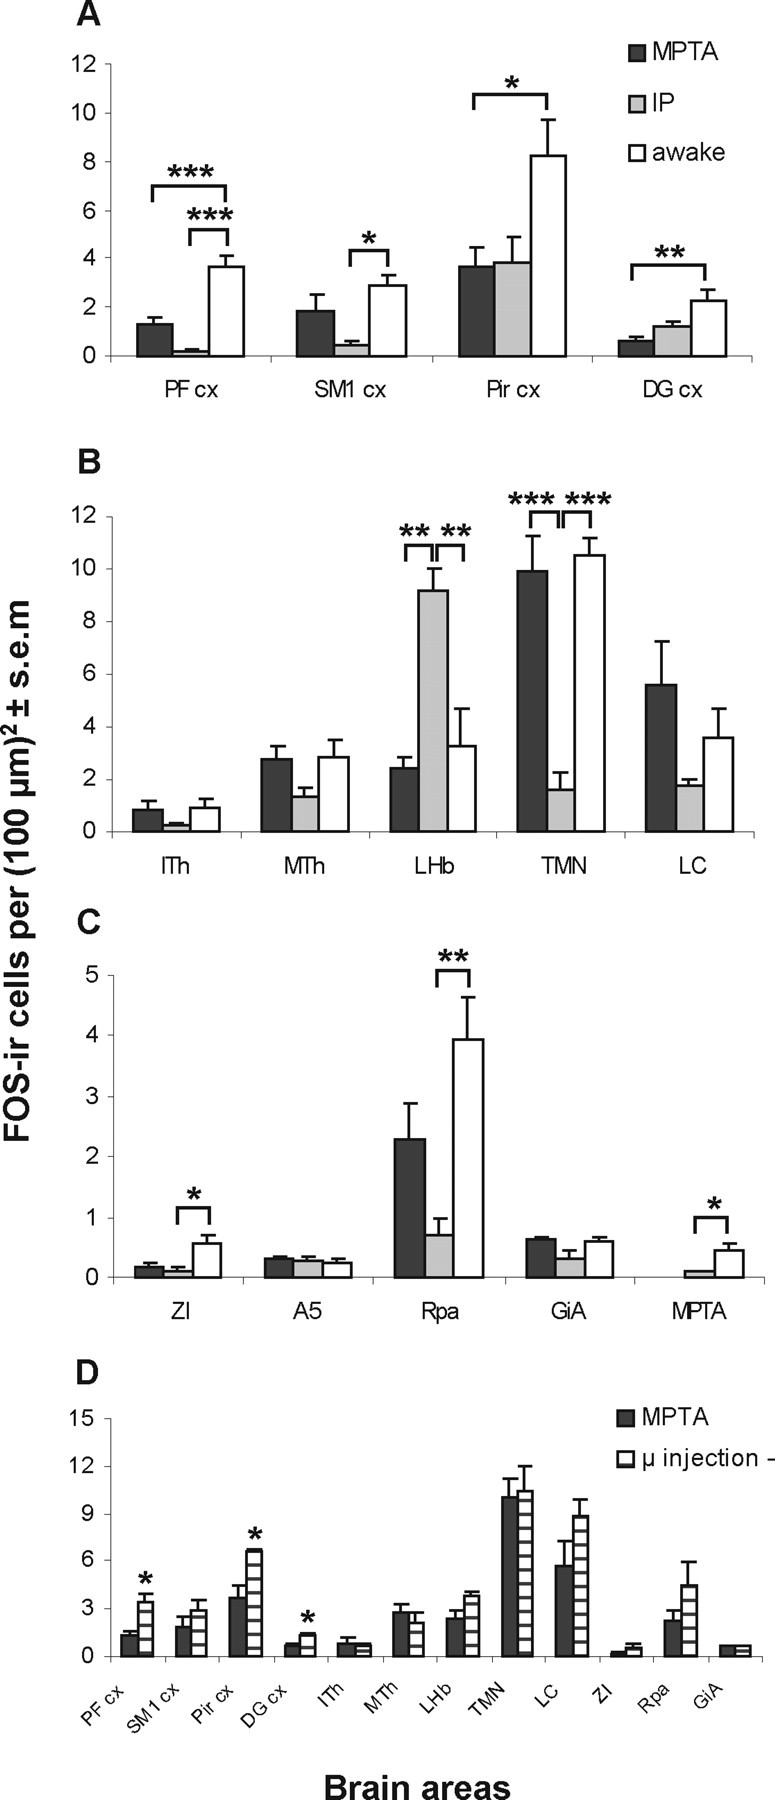
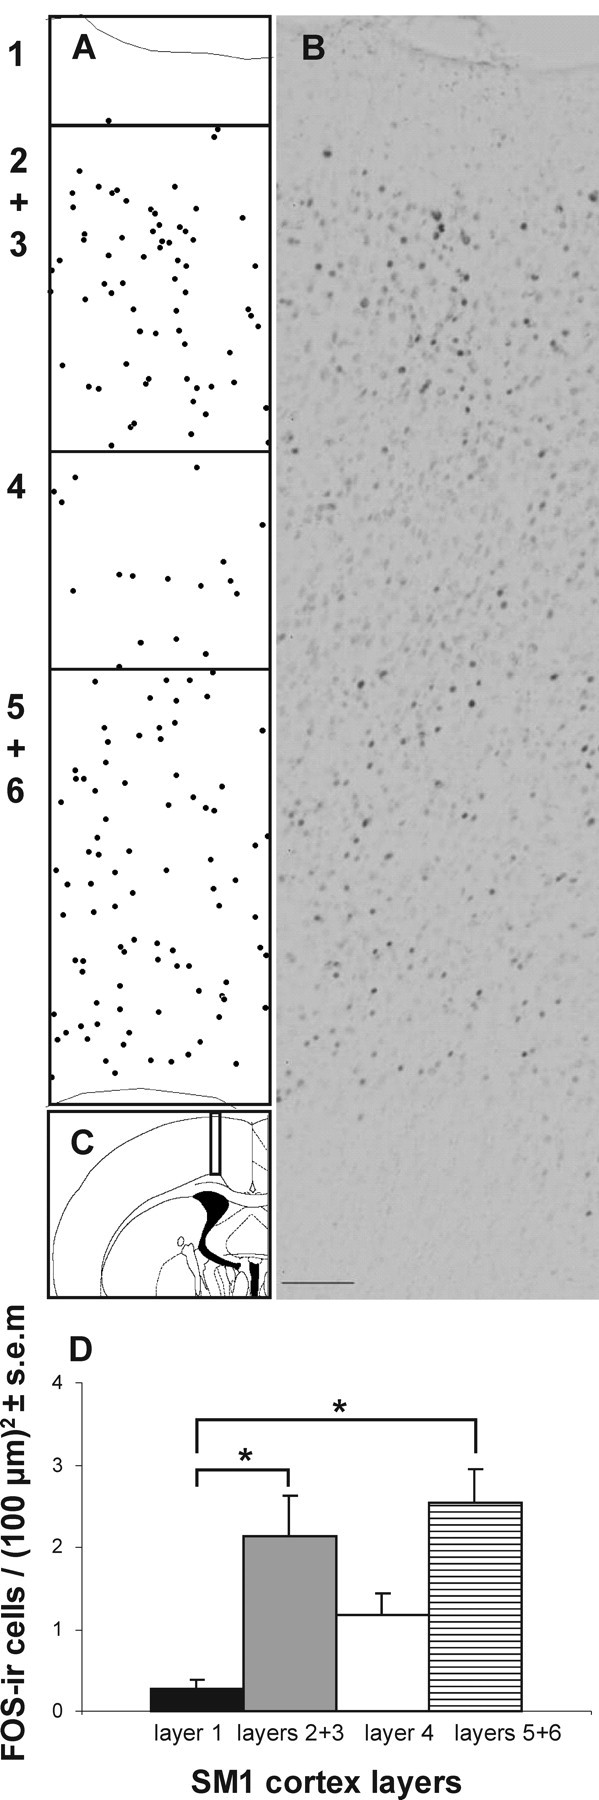
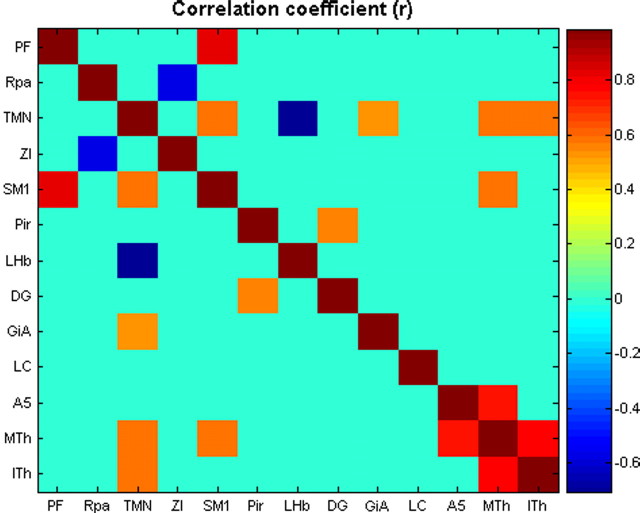
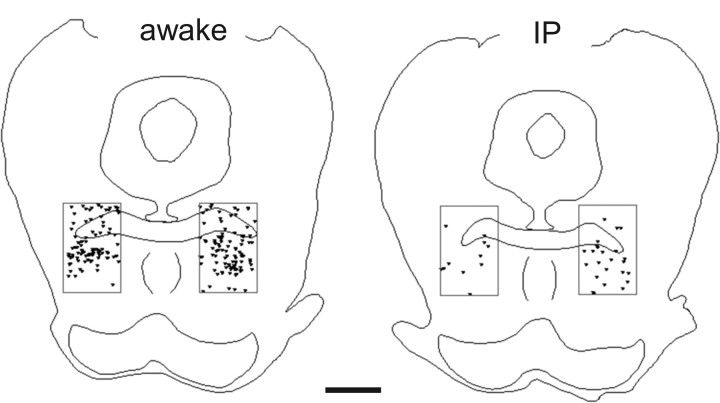
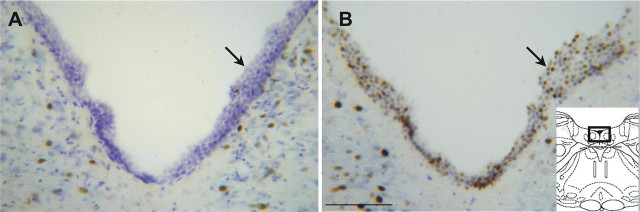
Microinjection of pentobarbital into a restricted region of rat brainstem, the mesopontine tegmental anesthesia area (MPTA), induces a reversible anesthesia-like state characterized by loss of the righting reflex, atonia, antinociception, and loss of consciousness as assessed by electroencephalogram synchronization. We examined cerebral activity during this state using FOS expression as a marker. Animals were anesthetized for 50 min with a series of intracerebral microinjections of pentobarbital or with systemic pentobarbital and intracerebral microinjections of vehicle. FOS expression was compared with that in awake animals microinjected with vehicle. Neural activity was suppressed throughout the cortex whether anesthesia was induced by systemic or MPTA routes. Changes were less consistent subcortically. In the zona incerta and the nucleus raphe pallidus, expression was strongly suppressed during systemic anesthesia, but only mildly during MPTA-induced anesthesia. Dissociation was seen in the tuberomammillary nucleus where suppression occurred during systemic-induced anesthesia only, and in the lateral habenular nucleus where activity was markedly increased during systemic-induced anesthesia but not following intracerebral microinjection. Several subcortical nuclei previously associated with cerebral arousal were not affected. In the MPTA itself FOS expression was suppressed during systemic anesthesia. Differences in the pattern of brain activity in the two modes of anesthesia are consistent with the possibility that anesthetic endpoints might be achieved by alternative mechanisms: direct drug action for systemic anesthesia or via ascending pathways for MPTA-induced anesthesia. However, it is also possible that systemically administered agents induce anesthesia, at least in part, by a primary action in the MPTA with cortical inhibition occurring secondarily.


Figures

Figure 1.
Figure 1.
Loci of microinjections in the MPTA. A, All microinjections were bilateral. Symbols mark single microinjections where each experiment is represented by a matched pair of symbols. Symbols designate the MPTA, IP, awake, and microinjection (−) groups as indicated. Microinjection locations were transposed to two standard planes, 7.3 and 8.0 mm caudal to bregma (−7.3, −8.0), using the atlas of Paxinos and Watson (1986). Microinjections closest to planes −7.30 and −7.64 were plotted as −7.3; microinjections closest to planes −7.80, −8.00, and −8.30 were plotted as −8.0. A total of 16 experiments are plotted: 4 at −7.3 and 12 at −8.0 (some symbols are superimposed). Aq, Intervertebral aqueduct; DRN, dorsal raphe nucleus; IC, inferior colliculus; LPT, lateral pontine tegmentum; ll, lateral lemniscus; MRN, median raphe nucleus; Pag, periaqueductal gray; Pn, pontine nuclei; PPT, pedunculopontine nucleus; SC, superior colliculus; xscp, decussation of the superior cerebellar peduncle. Scale bar, 1 mm. B, A coronal section at the level of the MPTA in a rat that underwent multiple microinjections of pentobarbital. These included three separate screening trials at increasing depths (following which the animal awoke to a normal level of vigilance) and three microinjections within the experimental protocol (MPTA group, arrows marked B in the right drawing in A, and diamond symbol in Fig. 2). The central defect, part of which may reflect tissue shrinkage, is surrounded by a shell of FOS-immunoreactive neurons. Scale bar, 1 mm.
Figure 2.
Figure 2.
Anesthesia score during the 50 min observation period in the four experimental groups in which pentobarbital or vehicle was microinjected into the MPTA. A, MPTA group. B, IP group. C, Awake group. D, Microinjection (−) group. Each line represents an individual animal. Upward-pointing arrows indicate intraperitoneal injections of either pentobarbital (solid arrows) or saline (dashed arrows) given before the observation period and of pentobarbital (long solid arrows) given at the end of the observation period as a prelude to perfusion. Downward-pointing arrows indicate intracerebral microinjection of pentobarbital (solid arrows) or vehicle (dashed arrows). The location of these arrows marks the average of the injection times of all animals in that group. Time 0 on the x-axis represents the time of completion of the first intracerebral (bilateral) microinjection.
Figure 3.
Figure 3.
Photomicrographs of FOS-immunoreactive nuclei in the MPTA, IP, and awake groups (left, center, and right columns, respectively). Outlines in the inset drawings on the right indicate the location and orientation of counting frames used to quantify FOS-IR. The inset drawings are coronal histological sections taken from the rat brain atlas of Paxinos and Watson (1998). Brain areas shown are as follows: A, PF cx (B = 4.20); B, DG cx (B = −2.56); C, LHb (B = −2.80); D, TMN (B = −4.16); E, A5 noradrenergic cell group, double labeled for TH-IR. An example of a double-labeled neuron is indicated with an arrow (main panel and magnified in inset) (B = −8.80). B values (in millimeters) refer to the anteroposterior location of the section in relation to bregma. Scale bars, 100 μm.
Figure 4.
Figure 4.
The mean density of FOS-immunoreactive neurons is affected by anesthesia in some, but not all, brain areas examined. A–C, Counts were made during the MPTA-induced anesthesia-like state (MPTA group), systemic pentobarbital anesthesia (IP group), and in the awake state (awake group). A, Cortical areas. B, C, Subcortical areas. Measurements in the MPTA were made in animals without intracerebral cannulae (see “supplemental groups” in the text). D, Comparison of FOS-IR density in animals in which microinjection of pentobarbital into the MPTA induced (MPTA group) or failed to induce [microinjection (−) group] an anesthesia-like state. The number of rats sampled was as follows: IP and awake groups, n = 4; microinjection (−) group, n = 3; MPTA group, n = 4 except for n = 5 in the PF cx, SM1 cx, Pir cx, and ZI, and n = 3 in the LC. *p < 0.05, **p < 0.01, ***p < 0.001.
Figure 5.
Figure 5.
The density of FOS-immunoreactive neurons varies with laminar depth in the cortex. A, B, Plot and photomicrograph showing the distribution of immunolabeled neurons in SM1 cx in an awake rat, ranging from the pial surface (top) to the subcortical white matter (bottom), B = −0.92. Each symbol in A represents one FOS-immunoreactive cell. The rectangle in C shows the approximate location from which A and B were taken. In D, values from each rat in all of the experimental groups are averaged. *p < 0.05. Scale bar, 100 μm.
Figure 6.
Figure 6.
In some brain areas there was a significant correlation between anesthesia score (integrated over the 50 min observation period) and the density of FOS-immunoreactive neurons. Symbols represent values of individual rats in the four experimental groups. For each area sampled, the linear regression line is given, with the associated correlation coefficient (r) and p value. See Table 2 for additional ROIs.
Figure 7.
Figure 7.
Partial correlation between pairs of ROIs from density of FOS-IR. Correlation coefficients are coded as indicated in the panel on the right. All values of r that yielded p > 0.05 were colored according to r = 0.
Figure 8.
Figure 8.
General anesthesia induced by systemic (intraperitoneal) pentobarbital substantially reduced the density of FOS-immunoreactive nuclei within the MPTA region (rectangles). Each symbol represents a single FOS-immunoreactive neuron in a representative section through the MPTA in one rat (B = −8.00). Animals were from the supplemental groups with no cannula implant. Left, Awake rat; right, anesthetized rat. Scale bar, 1 mm.
Figure 9.
Figure 9.
Microinjection of pentobarbital into the MPTA region induced FOS immunolabeling in ependymal cells in the fourth ventricle (arrows). A, Floor of the fourth ventricle in a rat in which vehicle was microinjected into the MPTA (IP group). B, Floor of the fourth ventricle in a rat in which pentobarbital was microinjected into the MPTA (MPTA group). The rectangle in the inset sketch on the right shows the approximate location of the photomicrographs. Scale bar, 100 μm.

References

    1. Alkire MT, Miller J. General anesthesia and the neural correlates of consciousness. Prog Brain Res. 2005;150:229–244. - PubMed
    1. Alkire MT, Haier RJ, Fallon JH. Toward a unified theory of narcosis: brain imaging evidence for a thalamocortical switch as the neurophysiologic basis of anesthetic-induced unconsciousness. Conscious Cogn. 2000;9:370–386. - PubMed
    1. Antkowiak B. Different actions of general anesthetics on the firing patterns of neocortical neurons mediated by the GABA(A) receptor. Anesthesiology. 1999;91:500–511. - PubMed
    1. Basbaum AI, Fields HL. Endogenous pain control systems: brainstem spinal pathways and endorphin circuitry. Annu Rev Neurosci. 1984;7:309–338. - PubMed
    1. Chaudhuri A. Neural activity mapping with inducible transcription factors. Neuroreport. 1997;8:iii–vii. - PubMed

Publication types

MeSH terms