. 2009 Aug 6;114(6):1174-85.
doi: 10.1182/blood-2009-01-201863. Epub 2009 May 27.

A novel human gamma-globin gene vector for genetic correction of sickle cell anemia in a humanized sickle mouse model: critical determinants for successful correction

Affiliations

A novel human gamma-globin gene vector for genetic correction of sickle cell anemia in a humanized sickle mouse model: critical determinants for successful correction

Ajay Perumbeti et al. Blood. .

Abstract

We show that lentiviral delivery of human gamma-globin gene under beta-globin regulatory control elements in hematopoietic stem cells (HSCs) results in sufficient postnatal fetal hemoglobin (HbF) expression to correct sickle cell anemia (SCA) in the Berkeley "humanized" sickle mouse. Upon de-escalating the amount of transduced HSCs in transplant recipients, using reduced-intensity conditioning and varying gene transfer efficiency and vector copy number, we assessed critical parameters needed for correction. A systematic quantification of functional and hematologic red blood cell (RBC) indices, organ pathology, and life span was used to determine the minimal amount of HbF, F cells, HbF/F-cell, and gene-modified HSCs required for correcting the sickle phenotype. We show that long-term amelioration of disease occurred (1) when HbF exceeded 10%, F cells constituted two-thirds of the circulating RBCs, and HbF/F cell was one-third of the total hemoglobin in sickle RBCs; and (2) when approximately 20% gene-modified HSCs repopulated the marrow. Moreover, we show a novel model using reduced-intensity conditioning to determine genetically corrected HSC threshold that corrects a hematopoietic disease. These studies provide a strong preclinical model for what it would take to genetically correct SCA and are a foundation for the use of this vector in a human clinical trial.


Figures

Figure 1
Figure 1
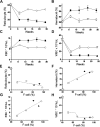
GbG mice that underwent transplantation after myeloablative conditioning have high HbF production that is stable and sustained in primary and secondary mice. GbG mice that were fully chimeric for donor RBCs were analyzed at different time points. The proportion of HbF (A) and F cells (B) in blood of individual mice, as determined by ion-exchange HPLC and FACS analysis, respectively, is shown at different time points after primary and secondary transplantations. (C) The amount of HbF in blood directly correlated with the proportion of F cells. (D) The amount of HbF produced was directly in proportion to the vector copy number in bone marrow. Each symbol represents one mouse (and consistently depicts the same particular mouse in all the panels).
Figure 2
Figure 2
GbG mice that underwent transplantation after myeloablative conditioning, which resulted in correction of hematologic parameters that correlated with the HbF expression. There was sustained reduction in reticulocytes (A), and increase in hematocrit (B) and RBC numbers (C) over time. (D) Leukocytosis decreased with normalization of WBC counts. Data shown represent mean (± SEM) values of GbG mice (n = 5; ●) and mice that underwent mock transplantation (n = 10; ○). ☆ represents mean values in BERK mice that were HSC donors for the GbG and mock transplantations. (E-G) Decrease in reticulocytes, and increased hematocrit and RBC numbers correlated with the proportion of F cells in individual mice. (H) WBC counts decreased but normalized when the F cells exceeded 60%. WBC counts, counted on an automated analyzer, were representative of circulating leukocytes, since only occasional nucleated RBCs were seen in peripheral smears. Each data point/symbol in panels E-H represents one GbG mouse and symbols for individual mice have been kept consistent, to trace individual mice in Figures 1 and 2. ☆ represents mean values in BERK mice that were HSC donors for the GbG and mock transplantations.
Figure 3
Figure 3
GbG mice that underwent transplantation after myeloablative conditioning, which resulted in correction of functional RBC parameters in primary and secondary mice. (A) Peripheral blood smears showing numerous irreversibly sickled cells (ISCs) in a mouse that underwent mock transplantation and a paucity of ISCs in a GbG mouse. (B) Quantification of ISCs in peripheral blood smears of BERK mice that did not undergo transplantation (n = 5), mock mice (n = 3), and GbG mice (n = 5). (*P < .05; **P < .01). (C) Deoxygenation of blood induces sickling of RBCs in a mock mouse; sickling is largely absent in a GbG mouse. (D) Quantification of sickle RBCs upon graded hypoxia (by tonometry) in the GbG mice (●), compared with mock mice (○). (E) RBC deformability by LORCA analysis in GbG, mock, and normal mice (C57, ⊗) analyzed at 18 weeks in primary transplant recipients. Similar data were seen in secondary recipients (data not shown). Flow at low (3 Pa) and high (28 Pa) shear stress is represented by shaded areas. (F) RBC half-life (determined by in vivo biotin labeling) in the GbG mice, mock/BERK mice, and normal mice after primary transplantations. Similar results were seen in secondary recipients (data not shown).
Figure 4
Figure 4
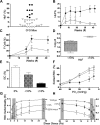
HbF expression and functional correction in GbG mice that underwent transplantation after reduced-intensity conditioning, separated into 2 groups: mice with HbF of 10% or more (GbG≥10) and mice with HbF of less than 10% (GbG<10). (A) HbF in individual BERK mice 18 weeks after transplantation of sGbG-transduced BERK HSCs, after reduced-intensity conditioning. (B-C) Stable and high HbF expression and F-cell repopulation in long-term survivors analyzed at 11 months. (D) Box and whisker plot showing vector copy numbers in GbG<10 and GbG≥10 mice, with mean vector copy number denoted by the line. Symbols in panels A through C represent mouse groups: ○ = mock (HbF 0%), ▽ = GbG<10 (HbF < 10%), and ● = GbG≥10 (HbF ≥ 10%). (E) The proportion of ISCs was reduced (P < .04) in GbG<10 mice, but was markedly reduced in GbG≥10 mice (P < .001), compared with mock mice. (F) Graded deoxygenation via tonometry demonstrates significant reduction in sickling at physiologically relevant partial oxygen pressures (PO2) in GbG≥10 mice, whereas GbG<10 mice RBC sickled similar to controls. (G-H) RBC deformability showed highly variable improvement in deformability in GbG<10 mice. In contrast, RBC deformability in GbG≥10 mice was highly significantly improved at low and high shear stress (P < .001). Symbols represent mouse groups: ○, mock; ▽, GbG<10; ●, GbG≥10; and ⊗, wild-type mice (C57BL/6). Gray shaded rectangles are representative of low and high shear stress through microvessels and large vessels, respectively. Error bars indicate SEM.
Figure 5
Figure 5
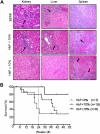
Correction of organ pathology in GbG≥10 mice that underwent transplantation after reduced-intensity conditioning and improved overall survival. (A) Representative hematoxylin-eosin–stained sections of a kidney, liver, and spleen of GbG≥10 and GbG<10 mice 48 to 50 weeks after reduced-intensity conditioning transplantation and a 3-month-old BERK control. Image acquisition information is available in supplemental data. (B) Kaplan-Meier survival curve showed significantly improved survival of the GbG≥10 mice compared with mock/GbG<10 mice at 50 weeks. Survival at 24 weeks is denoted by a dashed vertical line to compare with survival of the GbG mice in the myeloablative transplantation model (supplemental Figure 3c).
Figure 6
Figure 6
Effect of HbF, F cells, and percentage HbF/F cell required for functional improvement in RBC survival and deformability. (A) RBC half-life. Left panel shows a representative GbG mouse injected with biotin, with biotin-labeled F cells (upper right quadrants) and non-F cells (lower right quadrants) determined by FACS. Right panel shows survival of F cells (⊡), compared with the non-F cells (⊙) in GbG mice (n = 4); wild-type mice (△); and Berkeley mice (○). (B) A cohort of GbG mice analyzed for RBC survival in vivo, based upon the percentage of HbF/F cell. Each symbol represents a mouse group with HbF percentage and number of mice listed in the adjacent table legend. (C) All GbG and mock mice (n = 34) that were analyzed for RBC deformability were divided into groups based on proportion of F cells: 0%, 1% to 33%, 33% to 66%, and more than 66%, and deformability of total RBC in these mice was plotted at low (3 Pa, △) and high (28 Pa, ▽) shear stress. Significantly improved deformability over mock controls is denoted by *(P < .05) and **(P < .01). Error bars indicate SEM.
Figure 7
Figure 7
Proportion of transduced HSCs in GbG mice. Proportions in the myeloablative (A) and reduced-intensity (B) transplantation models are shown. The proportion of sGbG-transduced HSCs was determined by spleen colonies (30-36 colonies/mouse) by intracellular staining with HbF and HbS. Each bar represents an individual mouse. (A) In the myeloablative transplantation model, symbols beneath each bar (representing one mouse) are consistent with the symbols in mice labeled in Figures 1 and 2. (B) In the reduced-intensity group, bone marrow was successfully aspirated from 8 mice at 24 weeks and mice were followed for an additional 24 weeks. The HbF expression in peripheral blood by HPLC and bone marrow copy number of the respective mice at 24 weeks are labeled under each bar.

Similar articles

Cited by

References

    1. Darbari DS, Kple-Faget P, Kwagyan J, Rana S, Gordeuk VR, Castro O. Circumstances of death in adult sickle cell disease patients. Am J Hematol. 2006;81(11):858–863. - PubMed
    1. Platt OS, Brambilla DJ, Rosse WF, et al. Mortality in sickle cell disease: life expectancy and risk factors for early death. N Engl J Med. 1994;330(23):1639–1644. - PubMed
    1. Davis H, Schoendorf KC, Gergen PJ, Moore RM., Jr National trends in the mortality of children with sickle cell disease, 1968 through 1992. Am J Public Health. 1997;87(8):1317–1322. - PMC - PubMed
    1. World Health Organization. Sickle-Cell Anaemia. Fifty-Ninth World Health Assembly, Provisional Agenda Item 11.4. [Accessed June 13, 2006];2006 A59:1. http://www.who.int/gb/ebwha/pdf_files/WHA59/A59_9-en.pdf.
    1. Walters MC, Patience M, Leisenring W, et al. Barriers to bone marrow transplantation for sickle cell anemia. Biol Blood Marrow Transplant. 1996;2(2):100–104. - PubMed

Publication types