. 2009 Jun;7(2):93-111.
doi: 10.1007/s12021-009-9048-z. Epub 2009 May 28.

Database analysis of simulated and recorded electrophysiological datasets with PANDORA's toolbox

Affiliations

Database analysis of simulated and recorded electrophysiological datasets with PANDORA's toolbox

Cengiz Günay et al. Neuroinformatics. 2009 Jun.

Abstract

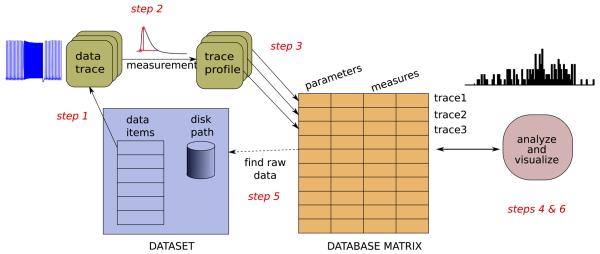
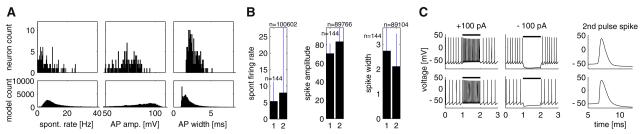
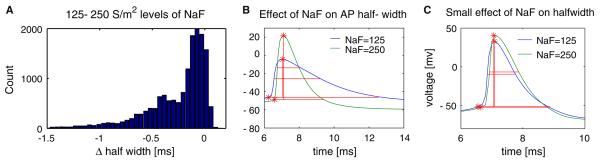
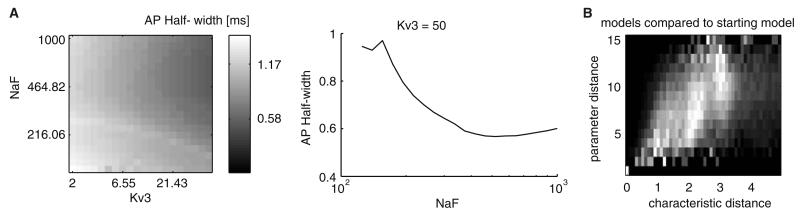
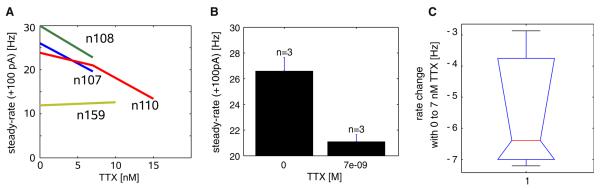
Neuronal recordings and computer simulations produce ever growing amounts of data, impeding conventional analysis methods from keeping pace. Such large datasets can be automatically analyzed by taking advantage of the well-established relational database paradigm. Raw electrophysiology data can be entered into a database by extracting its interesting characteristics (e.g., firing rate). Compared to storing the raw data directly, this database representation is several orders of magnitude higher efficient in storage space and processing time. Using two large electrophysiology recording and simulation datasets, we demonstrate that the database can be queried, transformed and analyzed. This process is relatively simple and easy to learn because it takes place entirely in Matlab, using our database analysis toolbox, PANDORA. It is capable of acquiring data from common recording and simulation platforms and exchanging data with external database engines and other analysis toolboxes, which make analysis simpler and highly interoperable. PANDORA is available to be freely used and modified because it is open-source (http://software.incf.org/software/pandora/home).


Figures

Fig. 1
Fig. 1
Main components of PANDORA. Raw data traces are analyzed to create measurement profiles and then inserted into the database matrix along with metadata. See text for the details of the required steps
Fig. 2
Fig. 2
PANDORA offers functions for automated measurement of electrophysiological characteristics from intracellular voltage traces. a Action potential (spike) shape characteristics of threshold, base width, amplitude and afterhyperpolarization (AHP) annotated on a single spike. b Automatically found spikes annotated on a recorded intracellular trace (PANDORA commands to obtain this plot are given in Supp. Matlab Code 1)
Fig. 3
Fig. 3
A simple example of creating a database from a 2 × 2 arbitrary data matrix. tests_db is the name of the database component and it also represents the constructor function that generates such database objects. The function uses its arguments to generate the database object assigned to the db_obj variable. The function arguments consist of the matrix data, metadata to label column and row dimensions, and finally an identifying name for the database (see the Supp. Methods and the online PANDORA Manual in Günay 2007, , for more details)
Fig. 4
Fig. 4
Electrophysiological activity of the real and model pyloric networks of the lobster stomatogastric ganglion. a Recorded functional network rhythms from the pyloric network. (b, c) Example functional (b) and non-functional (c) activity produced by the model pyloric networks
Fig. 5
Fig. 5
Extracted electrophysiological characteristics were adequate for comparing model and recorded GP neurons. a Spontaneous firing rate, action potential (AP) amplitude, and half-width characteristic distributions from the model neuron database were similar (symmetric KL divergence 6.19, 1.65, and 0.98 bits, respectively; see Supp. Methods A.1.6) and overlapped with distributions from the recorded neuron database. b Mean and standard deviation (STD) of the characteristics displayed in panel a (1: real, 2: model database). c Raw traces of matching real (top) and model (bottom) neurons
Fig. 6
Fig. 6
PANDORA's querying capability allows picking up models that exhibit characteristics in different regions of a distribution. a Histogram distribution of the effect of changing the fast sodium conductance (NaF) from 125 to 250 S/m2 on the action potential (AP) half-width in the GP model neuron database. b At a fixed conductance background in two example model neurons show a large change in AP half-width with increasing NaF. c Another pair of models show a small change in AP half-width with increasing NaF
Fig. 7
Fig. 7
Querying allowed systematic analysis of GP model neuron conductance parameter space. a Change of spike half-width in the two-parameter plane of NaF and Kv3 conductances (left) was displayed with a Matlab image plot, which was a useful method in depicting multivariate landscapes in the database. A cross-section of the plane showed the non-monotonic change in the half-width in the NaF dimension (right). b Density of models according of their distance in terms of parameters and measures from a chosen initial model. Each row was normalized to the maximal number of models found with a given parameter distance
Fig. 8
Fig. 8
TTX block effects on steady-state firing rate (steady-rate) measured at the end of the CIP period. a Change in the firing rate with various TTX concentrations (n = 4). Different invariant parameter backgrounds were separated by the invarValues function (see “Methods” and Supp. Matlab Code 2 for an example program). The parameter backgrounds of each neuron (e.g., n107) annotated on the plot were taken from available NeuronIds of the example subset of the GP cell database (Table 4). b Mean and standard error of rate for 0 and 7 nM TTX (n = 3), obtained using the statsMeanSE function from the results of invarValues. c The change in rate from the control condition to application of 7 nM TTX (n = 3), displayed using a Matlab box-plot from the results of the diff2D function (see Supp. Methods A.1.8)
Fig. 9
Fig. 9
Change in three characteristics for increasing values of several target maximal conductance parameters shows that each conductance affected multiple output characteristics in the model. The change was calculated as the difference in the characteristic for the displayed increase of a parameter value while other parameters were kept fixed. Bars show the mean and STD of this change for all combinations of the other background conductance density parameters
Fig. 10
Fig. 10
Interaction matrix between maximal conductance parameters and extracted characteristics in the model gave a comprehensive summary of conductance effects. This summary matrix was obtained by summing the mean change in characteristics (Fig. 9) between minimal to maximal values of each parameter
Fig. 11
Fig. 11
Models best-matching individual GP neurons can be found quantitatively. a A real neuron and the model that was found to match it most closely were compared by superimposing their raw voltage traces for ±100 pA CIP protocols aligned above their instantaneous firing rates (left), and the spike shape, and frequency-current (f-I) relationship plots (right). b The color-coded differences of individual characteristics of the top 50 matching models to the same real neuron, where the leftmost column represented the best matching model. Differences of characteristics were color-coded from dark blue (<1 STD) to red (>3 STDs). c Quality of the best matching models to each of the 146 real neurons visualized in the same way as panel b
Fig. 12
Fig. 12
Results of the lobster pyloric network sensor database analysis with PANDORA. a Success rate histogram of single inactivating and non-inactivating (DC) sensors, from a pool of 366 sensors, in distinguishing functional network patterns. b Success rate histogram of the 85,750 FSD sensor triplets in distinguishing functional network patterns showed up to 88% success. c Scatter plot of correlation between the sensor reading and the measured bursting duty cycle characteristic from the combined model of the anterior burster (AB) and pyloric dilator (PD) cells

Similar articles

Cited by

References

    1. Achard P, Schutter ED. Complex parameter landscape for a complex neuron model. PLoS Computers in Biology. 2006;2(7):e94. doi:10.1371/journal.pcbi.0020094. - PMC - PubMed
    1. Baxter SM, Day SW, Fetrow JS, Reisinger SJ. Scientific software development is not an oxymoron. PLoS Computers in Biology. 2006;2:975–978. - PMC - PubMed
    1. Bean BP. The action potential in mammalian central neurons. Nature Reviews. Neuroscience. 2007;8(6):451–465. doi:10.1038/nrn2148. - PubMed
    1. Bjaalie J. Understanding the brain through neuroinformatics. Front Neuroscience. 2008;2(1):19–21. doi:10.3389/neuro.01.022.2008. - PMC - PubMed
    1. Bjaalie JG, Grillner S. Global neuroinformatics: The international neuroinformatics coordinating facility. Journal of Neuroscience. 2007;27(14):3613–3615. doi:10.1523/jneurosci.0558-07.2007. - PMC - PubMed

Publication types