. 2009 Jun;109(5):1225-36.
doi: 10.1111/j.1471-4159.2009.06037.x. Epub 2009 Mar 14.

Cellular calcium deficiency plays a role in neuronal death caused by proteasome inhibitors

Affiliations

Cellular calcium deficiency plays a role in neuronal death caused by proteasome inhibitors

Shengzhou Wu et al. J Neurochem. 2009 Jun.

Abstract

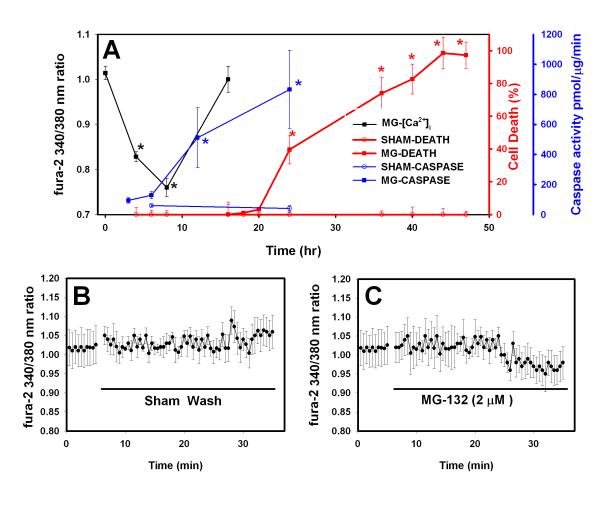
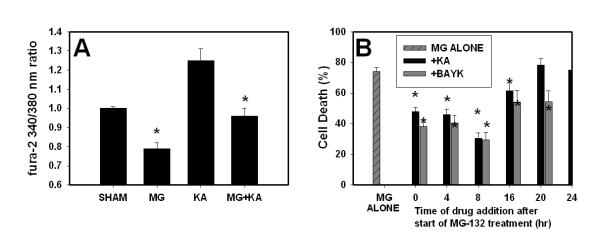
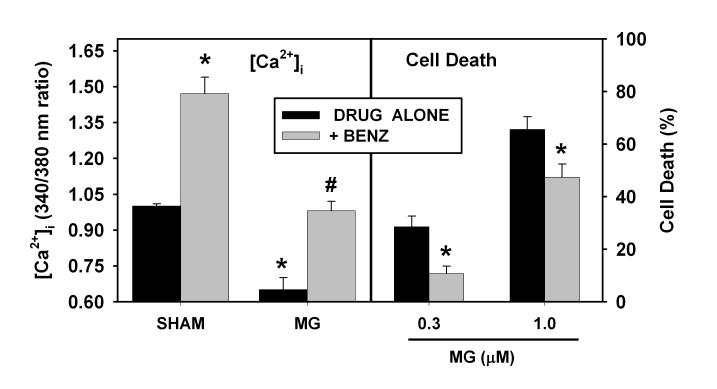
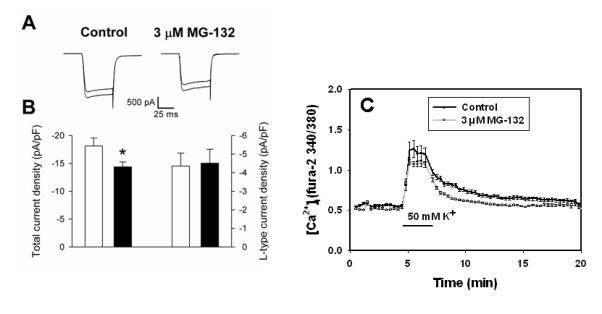
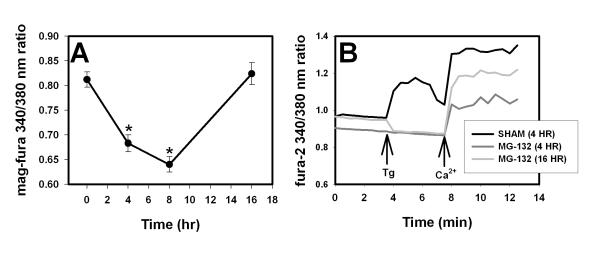
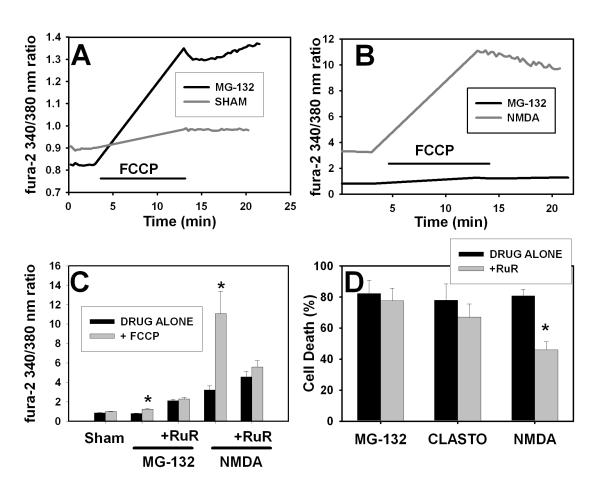
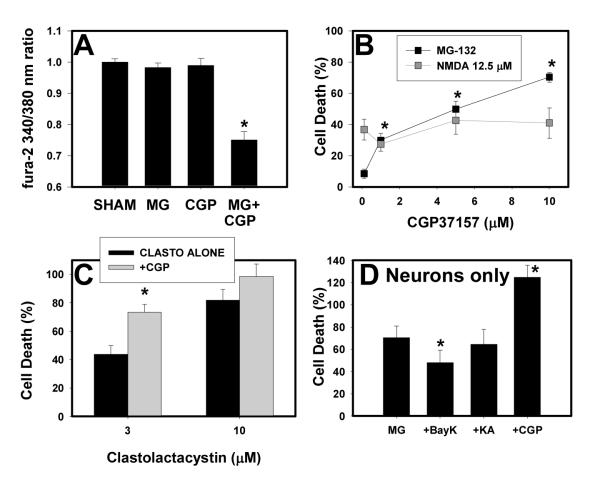
Cytosolic Ca(2+) concentration ([Ca(2+)](i)) is reduced in cultured neurons undergoing neuronal death caused by inhibitors of the ubiquitin proteasome system. Activation of calcium entry via voltage-gated Ca(2+) channels restores cytosolic Ca(2+) levels and reduces this neuronal death (Snider et al. 2002). We now show that this reduction in [Ca(2+)](i) is transient and occurs early in the cell death process, before activation of caspase 3. Agents that increase Ca(2+) influx such as activation of voltage-gated Ca(2+) channels or stimulation of Ca(2+) entry via the plasma membrane Na-Ca exchanger attenuate neuronal death only if applied early in the cell death process. Cultures treated with proteasome inhibitors had reduced current density for voltage-gated Ca(2+) channels and a less robust increase in [Ca(2+)](i) after depolarization. Levels of endoplasmic reticulum Ca(2+) were reduced and capacitative Ca(2+) entry was impaired early in the cell death process. Mitochondrial Ca(2+) was slightly increased. Preventing the transfer of Ca(2+) from mitochondria to cytosol increased neuronal vulnerability to this death while blockade of mitochondrial Ca(2+) uptake via the uniporter had no effect. Programmed cell death induced by proteasome inhibition may be caused in part by an early reduction in cytosolic and endoplasmic reticulum Ca(2+,) possibly mediated by dysfunction of voltage-gated Ca(2+) channels. These findings may have implications for the treatment of disorders associated with protein misfolding in which proteasome impairment and programmed cell death may occur.


Figures

Figure 1
Figure 1. Time course of neuronal death, caspase activity and [Ca2+]i following treatment with proteasome inhibitor (MG-132)
A. Cell death (red lines and symbols; Y-axis shown at right): Cultures were treated with proteasome inhibitors for 48 hr or sham-washed. Values shown are mean ± SEM cell death as assayed by propidium iodide fluorescence at the indicated time points. Values in sham-washed cultures were subtracted so death in sham-washed cultures =0%; there was no significant change in absolute fluorescence values for sham-washed cultures at any time point throughout the 48 hr treatment period. For all 3 measures shown in Panel A, * indicates death in MG-132-treated cultures differs significantly from that in sham-washed cultures; significance (P<0.05) was analyzed by ANOVA and Bonferroni post-hoc test. Caspase-3 activity (Blue line and symbols; Y-axis at far right): Cultures were treated as in the cell death assay. At the indicated time intervals after the start of the MG-132 treatment or sham wash, extracts were prepared and degradation of Ac-DEVD-AMC was determined. Values shown are mean ± SEM activity in pmol AMC cleaved/μg protein/min. Sham wash values did not differ significantly between any time points. Calcium imaging (Black line and symbols; Y-axis at left): cultures were sham-washed or treated with MG-132 and then returned to the incubator. At the indicated time after the start of drug treatment, cultures were loaded with fura-2 and images were collected. Values shown are mean ± SEM 340/380 ratios for n= 87-200 cells for each data point. Values shown are average of three consecutive measurements taken for each cell. MG-132 was included in the loading and washing buffers for treated cultures. B. Acute changes in [Ca2+]i. Cultures were loaded with fura-2 as in A. The solid line indicates when the cultures were sham washed. [Ca2+]i was measured every 30 seconds for an additional 30 min after the sham wash. Values shown are mean ± SEM 340/380 ratio for 15 neurons in two separate experiments. C. Similar to B, but MG-132 (2 μM) was added at the indicated time. Values shown are mean ± SEM 340/380 ratio for 17 neurons in two separate experiments.
Figure 2
Figure 2. Activating Ca2+ influx via voltage gated Ca2+ channels prevents proteasome inhibitor-induced [Ca2+]i depletion and attenuates neuronal death
A. Murine neocortical cultures were sham-washed (vehicle only) or treated with MG-132 (2 μM) in the presence or absence of kainate (10 μM) or with kainate alone. [Ca2+]i was imaged after 4 hr. Values shown are mean ± SEM 340/380 ratios for n= 40 cells for each data point. * indicates significant difference (P<0.05) from SHAM condition. B. Murine neocortical cultures were treated with MG-132 (1 μM) for 48 hr. (-) Bay K8644 (BayK, 10 μM) or kainate (KA, 10 μM) was added at the beginning of the treatment period at the indicated time after the start of the treatment period. Compounds added at time “0” were co-applied with the MG-132 and were present throughout the treatment period. Values shown are mean ± SEM cell death analyzed at the end of the 48 hr treatment period. * indicates values for KA or BayK treated cultures differed significantly (P<0.05) from those of sister cultures treated with MG-132 alone.
Figure 3
Figure 3. Blockade of the Na-Ca exchanger (NCX) increases [Ca2+]i and reduces vulnerability to MG-132-induced neuronal death
Left panel: [Ca2+]i measurements. Murine neocortical cultures were sham-washed (SHAM) or treated with benzamil (BENZ, 10 μM) for 4 hr in the absence (left two SHAM bars) or presence of MG-132 (MG, 1 μM) and then [Ca2+]i was measured as in Figure 1A. * indicates values were significantly different (P<0.05 by ANOVA with Bonferroni post hoc) from those in sham-washed condition without benzamil (left most bar). # indicates that cultures with BENZ+MG-132 differed from those treated with MG-132 alone. Values for MG-132 cultures treated with BENZ did not differ significantly from those in sham-washed condition without BENZ. Right panel: Cultures were treated with MG-132 (MG, 0.3 or 1.0 μM) for 48 hr in the presence or absence of benzamil (BENZ, 10 μM). Values shown are mean ± SEM cell death as assayed by propidium iodide fluorescence at the end of the 48 hr treatment period. * indicates values in +BENZ condition differ significantly from treated with MG alone.
Figure 4
Figure 4. Effect of proteasome inhibitor treatment on voltage-gated Ca2+ channel currents and Ca2+ influx
A. Representative Ca2+ currents elicited by voltage steps from -70 to 0 mV in a neuron treated with control medium and a neuron treated with 3 μM MG-132 for 4 hr. Currents were recorded in each neuron in the absence (larger trace) and presence (smaller trace) of 5 μM nifedipine. The capacitance of the control neuron was 24.7 pF and that of the MG-132-treated neuron was 25.6 pF. B. Summary of the total Ca2+ current density (two left-most bars) and the Ca2+ current density carried by L-type channels (two right-most bars) in control (open bars) and MG-132-treated (filled bars) neurons. n = 11-12; *P < 0.04. No statistically significant difference was observed in the L-type current density. C. Cultured neurons were sham-washed (Control) or treated with 3 μM MG-132 for 4 hr. Cultures were loaded with fura-2 and [Ca2+]i was imaged as in Figure 1. After 5 min, cultures were changed into media supplemented with 50 mM K+ for 2 min, then returned to control medium. Values shown are mean ± SEM 340/380 ratio for n= 96-100 cells per condition.
Figure 5
Figure 5. Effect of proteasome inhibitors on endoplasmic reticulum (ER) Ca2+ ([Ca2+]ER)
A. Measurement of [Ca2+]ER with mag-fura-2. Cultures were treated with MG-132 (2 μM) and then loaded with mag-fura-2 (see Methods) and [Ca2+]ER was analyzed at the indicated time points after the start of the treatment period; images and data analysis were similar to that for fura-2 in Figures 1 and 3. n= 87-143 cells per time point. * indicates significant difference (P<0.05 by ANOVA) from sham-washed (time = 0) condition. B. Indirect measurement of [Ca2+]ER with fura-2 and thapsigargin. Cultures were treated with MG-132 (2 μM) for 4 hr or 16 hr (darker and lighter gray lines respectively) or sham-washed for 4 hr (black line). Cultures were loaded with fura-2; before imaging, the media was changed to calcium free buffer. Baseline [Ca2+]i was measured in Ca2+-free media and the cells were treated with thapsigargin (5 μM). After 5 min, thapsigargin was washed out, 1.8 mM calcium was added to the bathing media and [Ca2+]i was measured for another 5 minutes. A representative trace is shown for each condition. Similar results were obtained for n= 8-10 cells each condition. MG-132 was present in treated cultures throughout the experiment.
Figure 6
Figure 6. Effects of proteasome inhibitor on mitochondrial Ca2+ levels and role of mitochondrial Ca2+ in proteasome inhibitor and NMDA-induced neuronal death
A. Murine neocortical cultures were sham-washed (gray line) or treated with MG-132 (1 μM, black line) as in Figure 1. After 3 hr drug treatment, cultures were loaded with fura-2; MG-132 was included in the loading and washing buffers for treated cultures. Cultures were washed into Ca2+-free buffer and basal ratios were obtained. Cultures were treated with FCCP (10 uM) for 10 min, then FCCP was washed out and image acquisition continued. A representative tracing is shown for each condition. Similar results were obtained for at least 40 individual cells per condition in three independent experiments (averaged data is shown in Panel C). B. Cultures were treated with NMDA (300 μM for 10 min, gray line) prior to imaging. Results for NMDA were obtained from n =10 cells in two separate experiments. Data shown here for MG-132 (black line) is same as shown in Panel A; it is reproduced here to demonstrate difference in scale. C. Pooled results for experiments shown in A-B and effect of blockade of the mitochondrial uniporter with ruthenium red. Cultures were treated with NMDA and MG-132 as in A and B. The indicated cultures were pretreated with ruthenium red (RuR, 10 μM) for 1 hr prior to the start of the MG-132 treatment; ruthenium red was present in the indicated cultures throughout the experiment. For NMDA treatment regimen: RuR was added 45 min before NMDA treatment; 300 μM NMDA was added to the cultures for 10 min before the buffers were changed to Ca2+ free media; all images were acquired in the Ca2+ free media. Values shown are average ± SEM basal 340/380 excitation ratio (time point just prior to addition of FCCP) and peak 340/380 excitation ratio at the end of the 10 min FCCP treatment for at least 40 cells per condition. * indicates “+FCCP” condition differs significantly (P<0.05) from “DRUG ALONE.” Differences between basal and peak levels after FCCP were analyzed for significance using Student’s t-test. There was no difference between + and − FCCP conditions in cultures treated with ruthenium red. D. Effect of ruthenium red on neuronal death caused by proteasome inhibitors or NMDA. Murine neocortical neurons were treated with 1 μM MG-132 or 10 μM clastolactacystin for 48 hr or with 15 μM NMDA for 24 hr. Ruthenium red was present during the treatment period in the indicated cultures (+RuR, 10 μM). Values shown are mean ± SEM cell death measured using propidium iodide staining at the end of the treatment period. Similar results were obtained using lactate dehydrogenase efflux as a measure of cell death. * indicates “+ RuR” condition differs significantly from “DRUG ALONE” (P<0.05 by ANOVA with Bonferroni post hoc).
Figure 7
Figure 7. Blockade of mitochondrial Ca2+ efflux exacerbates the proteasome inhibitor induced reduction in [Ca2+]i and neuronal death
A. Murine neocortical cultures were sham-washed (Sham) or treated with 0.3 μM MG-132, 10 μM CGP-37157 (CGP), or both. [Ca2+]i was measured after 4 hr as in Figure 1. Values shown are mean ± SEM 340/380 ratio for 22-37 cells per condition. * indicates significant difference (P<0.001) from sham condition. B. Cultures were treated with MG-132 (0.3 μM) or NMDA (12.5 μM) alone or with the indicated concentration of CGP-37157; values shown are mean ± SEM cell death as measured by propidium iodide efflux at the end of the treatment period (48 hr for MG-132, 24 hr for NMDA). * indicates that neuronal death in cultures treated with MG-132 + the indicated concentration of CGP-37157 differed significantly from that in cultures treated with MG-132 without CGP-37157 (P<0.05 by ANOVA with Bonferroni post hoc). None of the NMDA+CGP-37157 conditions differed significantly from NMDA alone. Similar results were obtained using lactate dehydrogenase efflux as a measure of neuronal death. C. Cultures were treated with the indicated concentration of clastolactacystin for 48 hr alone or with 10 μM CGP-37157. Values shown are mean ± SEM cell death as measured by propidium iodide efflux; * indicates values in +CGP condition differ significantly from those in clastolactacystin only condition. D. Neuronally-enriched neocortical cultures (>95% neurons) were treated with 0.1 μM MG-132 for 48 hr alone, or in the presence of 10 μM BayK, kainate (KA) or CGP-37157 (CGP). Values shown are mean ± SEM cell death measured by propidium iodide fluorescence at the end of the treatment period. * indicates significant difference (P<0.05 by ANOVA with Bonferroni post hoc) from MG only condition.

Similar articles

Cited by

References

    1. Arundine M, Tymianski M. Molecular mechanisms of glutamate-dependent neurodegeneration in ischemia and traumatic brain injury. Cell Mol Life Sci. 2004;61:657–668. - PMC - PubMed
    1. Berliocchi L, Bano D, Nicotera P. Ca2+ signals and death programmes in neurons. Philos.Trans. R. Soc. Lond. B Biol. Sci. 2005;360:2255–2258. - PMC - PubMed
    1. Brocard JB, Tassetto M, Reynolds IJ. Quantitative evaluation of mitochondrial calcium content in rat cortical neurones following a glutamate stimulus. J. Physiol. 2001;531:793–805. - PMC - PubMed
    1. Buckler KJ, Vaughan-Jones RD. Effects of mitochondrial uncouplers on intracellular calcium, pH and membrane potential in rat carotid body type I cells. J. Physiol. 1998;513(Pt 3):819–833. - PMC - PubMed
    1. Canzoniero LM, Babcock DJ, Gottron FJ, et al. Raising intracellular calcium attenuates neuronal apoptosis triggered by staurosporine or oxygen-glucose deprivation in the presence of glutamate receptor blockade. Neurobiol. Dis. 2004;15:520–528. - PubMed

Publication types

MeSH terms