

A simulation analysis to characterize the dynamics of vaccinating behaviour on contact networks
- PMID: 19476616
- PMCID: PMC2695470
- DOI: 10.1186/1471-2334-9-77
A simulation analysis to characterize the dynamics of vaccinating behaviour on contact networks
Abstract
Background: Human behavior influences infectious disease transmission, and numerous "prevalence-behavior" models have analyzed this interplay. These previous analyses assumed homogeneously mixing populations without spatial or social structure. However, spatial and social heterogeneity are known to significantly impact transmission dynamics and are particularly relevant for certain diseases. Previous work has demonstrated that social contact structure can change the individual incentive to vaccinate, thus enabling eradication of a disease under a voluntary vaccination policy when the corresponding homogeneous mixing model predicts that eradication is impossible due to free rider effects. Here, we extend this work and characterize the range of possible behavior-prevalence dynamics on a network.
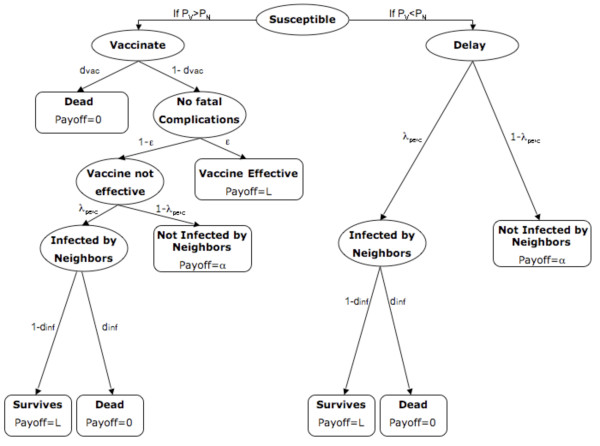
Methods: We simulate transmission of a vaccine-preventable infection through a random, static contact network. Individuals choose whether or not to vaccinate on any given day according to perceived risks of vaccination and infection.
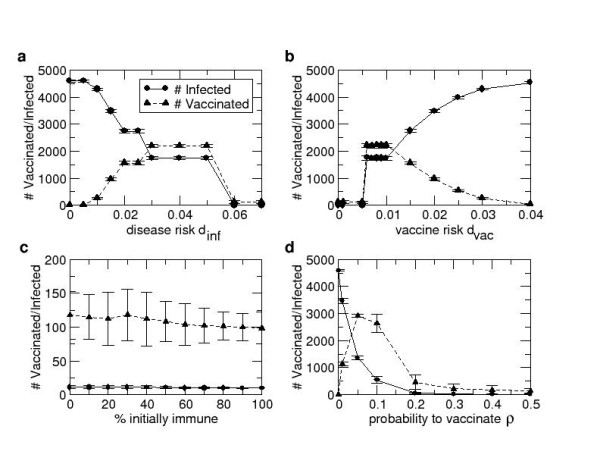
Results: We find three possible outcomes for behavior-prevalence dynamics on this type of network: small final number vaccinated and final epidemic size (due to rapid control through voluntary ring vaccination); large final number vaccinated and significant final epidemic size (due to imperfect voluntary ring vaccination), and little or no vaccination and large final epidemic size (corresponding to little or no voluntary ring vaccination). We also show that the social contact structure enables eradication under a broad range of assumptions, except when vaccine risk is sufficiently high, the disease risk is sufficiently low, or individuals vaccinate too late for the vaccine to be effective.
Conclusion: For populations where infection can spread only through social contact network, relatively small differences in parameter values relating to perceived risk or vaccination behavior at the individual level can translate into large differences in population-level outcomes such as final size and final number vaccinated. The qualitative outcome of rational, self interested behaviour under a voluntary vaccination policy can vary substantially depending on interactions between social contact structure, perceived vaccine and disease risks, and the way that individual vaccination decision-making is modelled.
Figures

References
-
- World Watch Institute, ISBN 0-393-32666-7. State of the world 2005. http://www.worldwatch.org/node/68
-
- Leitenberg M. Deaths in wars and conflicts in the 20th century. Cornel University Peace Studies Program ISSN 1075-4857. 2006;3(29):4.
-
- World Health Organization. The World Health Report. http://www.who.int/whr/1995/en/
-
- Bernoulli D. Essai dune nouvelle analyse de la mortalite causee par la petite verole et des avantages de linoculation pour la prevenir. Memoires de Mathematiques et de Physique, Academie Royale des Sciences. 1760. pp. 1–45.
-
- Klein E, Laxminarayan R, Smith D, Gilligan C. Economic incentives and mathematical models of diseases. Environment and Development Economics. 2007;12:707–732. doi: 10.1017/S1355770X0700383X. - DOI
Publication types
MeSH terms
LinkOut - more resources
Full Text Sources
Medical
