Sample size calculation for microarray experiments with blocked one-way design
- PMID: 19476634
- PMCID: PMC2702333
- DOI: 10.1186/1471-2105-10-164
Sample size calculation for microarray experiments with blocked one-way design
Abstract
Background: One of the main objectives of microarray analysis is to identify differentially expressed genes for different types of cells or treatments. Many statistical methods have been proposed to assess the treatment effects in microarray experiments.
Results: In this paper, we consider discovery of the genes that are differentially expressed among K (> 2) treatments when each set of K arrays consists of a block. In this case, the array data among K treatments tend to be correlated because of block effect. We propose to use the blocked one-way ANOVA F-statistic to test if each gene is differentially expressed among K treatments. The marginal p-values are calculated using a permutation method accounting for the block effect, adjusting for the multiplicity of the testing procedure by controlling the false discovery rate (FDR). We propose a sample size calculation method for microarray experiments with a blocked one-way design. With FDR level and effect sizes of genes specified, our formula provides a sample size for a given number of true discoveries.
Conclusion: The calculated sample size is shown via simulations to provide an accurate number of true discoveries while controlling the FDR at the desired level.
Figures

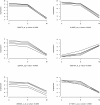
 = {k - (K + 2)/2}/K for 1 ≤ k ≤ K.

Similar articles
-
Sample size for FDR-control in microarray data analysis.Bioinformatics. 2005 Jul 15;21(14):3097-104. doi: 10.1093/bioinformatics/bti456. Epub 2005 Apr 21. Bioinformatics. 2005. PMID: 15845654
-
Construction of null statistics in permutation-based multiple testing for multi-factorial microarray experiments.Bioinformatics. 2006 Jun 15;22(12):1486-94. doi: 10.1093/bioinformatics/btl109. Epub 2006 Mar 30. Bioinformatics. 2006. PMID: 16574697
-
A weighted sample size for microarray datasets that considers the variability of variance and multiplicity.J Biosci Bioeng. 2009 Sep;108(3):252-8. doi: 10.1016/j.jbiosc.2009.03.017. J Biosci Bioeng. 2009. PMID: 19664562
-
Practical FDR-based sample size calculations in microarray experiments.Bioinformatics. 2005 Aug 1;21(15):3264-72. doi: 10.1093/bioinformatics/bti519. Epub 2005 Jun 2. Bioinformatics. 2005. PMID: 15932903
-
Controlling for false discoveries subsequently to large scale one-way ANOVA testing in proteomics: Practical considerations.Proteomics. 2023 Sep;23(18):e2200406. doi: 10.1002/pmic.202200406. Epub 2023 Jun 25. Proteomics. 2023. PMID: 37357151 Review.
Cited by
-
Computing Power and Sample Size for the False Discovery Rate in Multiple Applications.Genes (Basel). 2024 Mar 7;15(3):344. doi: 10.3390/genes15030344. Genes (Basel). 2024. PMID: 38540403 Free PMC article.
References
-
- Benjamini Y, Hochberg Y. Controlling the false discovery rate: a practical and powerful approach to multiple testing. JR Statist Soc B. 1995;57:289–300.
-
- Westfall PH, Wolfinger RD. Multiple tests with discrete distributions. American Statistician. 1997;51:3–8. doi: 10.2307/2684683. - DOI
-
- Muller P, Parmigiani G, Robert C, Rousseau J. Optimal sample size for multiple testing: the case of gene expression microarrays. J Am Stat Assoc. 2004;99:990–1001. doi: 10.1198/016214504000001646. - DOI
Publication types
MeSH terms
Grants and funding
LinkOut - more resources
Full Text Sources

