. 2009 May 28;62(4):539-54.
doi: 10.1016/j.neuron.2009.03.025.

A general model of synaptic transmission and short-term plasticity

Affiliations

A general model of synaptic transmission and short-term plasticity

Bin Pan et al. Neuron. .

Abstract

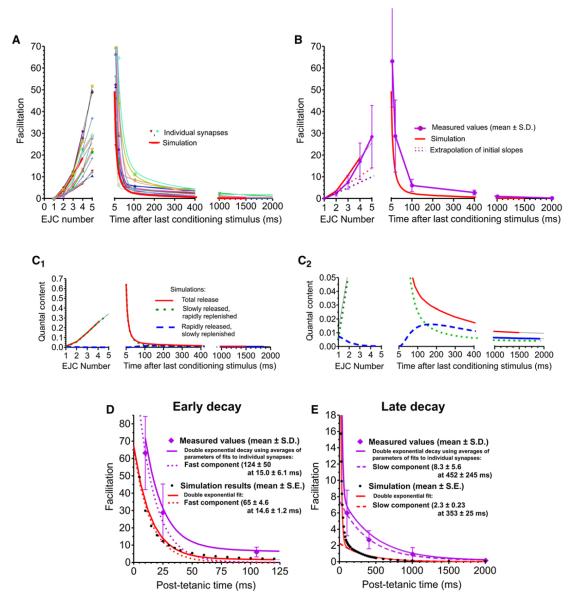
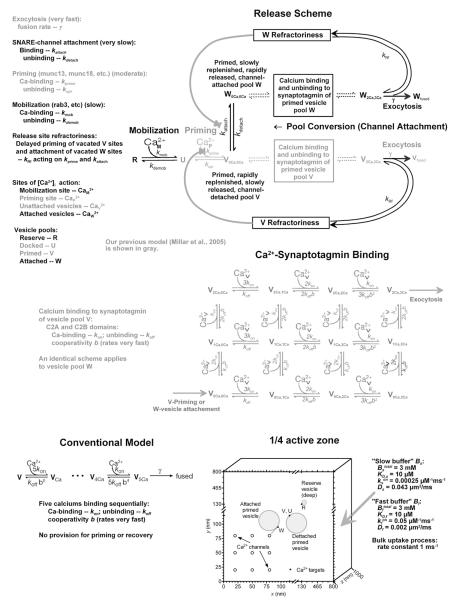
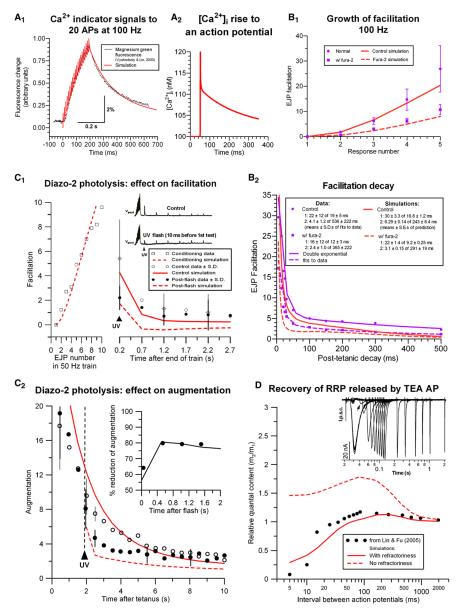
Some synapses transmit strongly to action potentials (APs), but weaken with repeated activation; others transmit feebly at first, but strengthen with sustained activity. We measured synchronous and asynchronous transmitter release at "phasic" crayfish neuromuscular junctions (NMJs) showing depression and at facilitating "tonic" junctions, and define the kinetics of depression and facilitation. We offer a comprehensive model of presynaptic processes, encompassing mobilization of reserve vesicles, priming of docked vesicles, their association with Ca(2+) channels, and refractoriness of release sites, while accounting for data on presynaptic buffers governing Ca(2+) diffusion. Model simulations reproduce many experimentally defined aspects of transmission and plasticity at these synapses. Their similarity to vertebrate central synapses suggests that the model might be of general relevance to synaptic transmission.


Figures

Figure 1
Figure 1. Evoked Release at Phasic Synapses
Responses toa five-spike 100 Hz train, recorded as focal extracellular potentials reporting postsynaptic current, in NVH. (A) Sample traces from one preparation; #, synchronous release; *, asynchronous release. (B) Average of 100 trials in the same preparation. (C) Averaged responses from 14 preparations (thin colored lines), with global average ± SD (thick gray line), predictions from a simple model of depletion from a single pool (thick blue line), or from two independent pools (thick green line), and simulations from our full model (dashed line). (D) Synchronous release rates during EJCs from one preparation, estimated by deconvolution of EJC with average mEJC; 0.1 ms bins (full dataset in Figure S1). (E) Asynchronous release rates from the same preparation, estimated by counting mEJCs between EJCs ; 0.5 ms bins (full dataset in Figure S2). (F and G) Composite synchronous and asynchronous release rates from 11 synapses.
Figure 2
Figure 2. Measured and Simulated Release from Phasic Synapses in NVH
Responses tofive stimuli at 100 Hz. (A1) Release rates averaged from 11 preparations estimated by deconvolution (black line) or by counting mEJPs (green line ± SD shown as light green area). Simulation 1 (dashed blue line, “fast buffer” diffusion constant [Df] of 0) and simulation 2 (solid red line, Df = 0.002 μm2/ms) rescaled to overlay peak rates (16.4 and 12.3 quanta/ms) on measured peak release rate (8.7/ms). (A2 and A4) Magnified synchronous release periods (gray regions in all panels) for first and fifth responses from (A1), showing measurements and simulation 2: the fifth response is broader (wider half width, horizontal dashed lines) and begins earlier than the first response. (B) Expansion of (A1) showing asynchronous release. (A3) Quantal contents (green bars, ±SD) and simulations (in blue for Df = 0 and red for Df = 0.002 μm2/ms); first quantal contents: 8.06 (experimental), 7.91 (simulation 1), and 9.21 (simulation 2).
Figure 3
Figure 3. Depression at Phasic Synapses in Cesium Ringer
Growth of, and recovery from, depression at nine phasic synapses stimulated ten times at 100 Hz. (A) Correlation between depression of the second (squares, left ordinate) or fifth responses (triangles, right ordinate) and initial quantal content. Four synapses with intermediate depression uncorrelated (p > 0.05) with initial amplitude (symbols within box) were used for analysis. (B) Responses averaged from 20 trials for individual boutons (gray lines), means ± SDs for all synapses (black symbols), simple single-pool (blue line) and two-pool (green line) depletion models, and simulations of our model (solid red line); the latter is separated into release from willingly (W, dashed line) and reluctantly released (V, dotted line) pools. (C) Recovery from depression in five boutons (colored symbols, averages of 20 trials), showing double exponentials (r2 ≥ 0.97) fitted to each (colored lines). The global average (thick gray line) is a double exponential using parameters averaged from these fits (boxed values). Simulated recovery (black line) is separated into vesicle pools W (dashed line) and V (dotted line). For double-exponential fits, the amplitude and time constant of each exponential is indicated (±SDs for data; ±SEs for simulation parameters). (D) Cumulative quantal content from simulations (red symbols) used to estimate RRP (red line) from 20-AP 100 Hz train, and an example of experimental data (green symbols and line). Dashed line shows larger RRP estimated from simulation of total cumulative release, including asynchronous release.
Figure 4
Figure 4. Measured and Simulated Release at Tonic Synapses
Measured and simulated release from tonic synapses stimulated five times at 100 Hz in NVH. (A1) Sample focal extracellular EJCs; #, synchronous release; †, second element of a rare two-quantum synchronous response; *, asynchronous release; ↖, nerve terminal potential. (A2) Superimposed traces (500) from another preparation, showing synchronous and asynchronous release. (A3) Histogram of release rates from the preparation of (A1); full dataset in Figure S3. (B1) Release rates (green line ±SD shown as light green area) averaged from 13 synapses. Gray regions mark synchronous release periods. Lines are model simulations with Df = 0 (simulation 1, dashed blue line) or 0.002 μm2/ms (simulation 2, dotted pink line) without refractoriness, and Df = 0.002 μm2/ms with refractoriness (simulation 3, solid red line), scaled so peak rates (0.365 [simulation 1] and 0.45 [simulations 2 and 3] quanta/ms) overlap measured peak release rate (0.22 quanta/ms) in the fifth response. (B2 and B4) Enlarged first and fifth responses, respectively, from (B1). (B3) Measured (means ± SDs) and predicted facilitation; measured m1 = 0.015 ± 0.011 (n = 13); simulated m1 = 0.012–0.013.
Figure 5
Figure 5. Facilitation at Tonic Synapses
Growth of, and recovery from, facilitation at tonic synapses stimulated five times at 100 Hz. (A) Data from 13 focal extracellular recordings (symbols, and thin colored lines, which for decay are two-exponential fits), compared with simulation (thick red lines). (B) Averaged results ±SDs (purple lines and symbols) and simulation (red lines); dashed lines show initial growth rates of facilitation, illustrating acceleration. (C1 and C2) Predicted release from the rapidly and slowly released vesicle pools (dashed blue and dotted green lines, respectively) and total release (solid red lines); (C2) expands foot of (C1) to reveal the rapidly released pool. (D and E) Fast and slow phases of facilitation decay at two timescales showing measured averages (purple diamonds with SDs), double-exponential fit (solid purple line, parameters averaged from fits in [A]), and fast and slow components of this fit (dotted and dashed purple lines, respectively). Simulated results (small black circles) are shown with a double-exponential fit (solid red line) and fast and slow components (dotted and dashed red lines, respectively). The components of fits are unrelated to vesicle pools in model simulations.
Figure 6
Figure 6. Reaction and Geometrical Schemes Used for Simulations
The complete release scheme includes mobilization of vesicles from a reserve pool (R) to a docked, unprimed pool (U), molecular priming to vesicles unattached to a Ca2+ channel (V), and conversion to vesicles coupled to a Ca2+ channel (W). Primed vesicle pools are released by only one isoform of synaptotagmin binding three Ca2+ ions to C2A domains and two Ca2+ ions to C2B domains with positive cooperativity (reducing off-rates). Upon full binding, exocytosis occurs at rate γ. All transitions except exocytosis are reversible, and mobilization and priming are Ca dependent. A vesicle cannot be released from a vacated site for a time determined by refractoriness, implemented by reducing the priming or conversion rate in proportion to the fractional loss of vesicles in the pool from which exocytosis occurred. New model provisions are in black; those in Millar et al. (2005) are in gray. The conventional synaptotagmin model (Bollmann et al., 2000; Schneggenburger and Neher, 2000) is shown for comparison. The sketch indicates dimensions and locations of Ca2+ channels and vesicles in pools R, U, V, and W, the sites of Ca2+ action on those pools (small dots), and properties of endogenous buffers and uptake. (B) Growth of facilitation (B1) in a train of five APs at 100 Hz, and its subsequent decay (B2), from Tang et al. (2000) (in black) with simulations (in red). Circles and solid lines, control experiments; squares and dashed lines, after injection of fura-2 as an exogenous buffer. Quantal content of first simulated response is 0.12. In (B1), error bars represent SDs. (C1) Rapid production of exogenous buffer by flash photolysis of diazo-2 reduces facilitation after a 50 Hz train of ten APs; inset shows data from Kamiya and Zucker (1994). Left plot: facilitation of EJPs in the train (data, squares; simulation, dashed red line). Right plot: late decay of facilitation; controls without photolysis (open circles with exemplar SDs, and simulation as solid red line) versus responses after photolysis (filled circles with exemplar thicker SDs, and simulation as dashed red line). (C2) Decay of augmentation following 200 APs at 50 Hz, tested at 0.5 Hz (from Kamiya and Zucker, 1994). Only augmentation remains 2 s after train; its reduction by diazo-2 photolysis 50 ms before the fourth test peaks after a 0.5 s delay. Open circles with SDs represent controls (no photolysis), whereas filled circles with thick SDs represent responses after photolysis. The solid red line represents simulated control responses, whereas the dashed red line represents simulated responses after photolysis. Inset: measurements (circles) and simulations (lines). (D) Recovery of a releasable pool measured by paired stimulation with APs prolonged 9-fold by TEA; data (filled circles) and simulations (in red) with (solid line) and without (dashed line) refractoriness. Time is plotted logarithmically, as in the inset illustrating junctional currents from Lin and Fu (2005).
Figure 7
Figure 7. Simulating Results from Opener Synapses
(A1) Mg-green fluorescence (in black) from Vyshedskiy and Lin (2000) to a train of 20 APs at 100 Hz compared with our simulation (scaled and overlaid as red trace). The ordinate applies to the simulation; the scale bar applies to data. (A2) Predicted volume-averaged [Ca2+]i elevation to a single AP in a bouton.

References

    1. Adams SR, Kao JPY, Tsien RY. Biologically useful chelators that take up Ca2+ upon illumination. J. Am. Chem. Soc. 1989;111:7957–7968.
    1. Atwood HL, Bittner GD. Matching of excitatory and inhibitory inputs to crustacean muscle fibers. J. Neurophysiol. 1971;34:157–170. - PubMed
    1. Atwood HL, Karunanithi S. Diversification of synaptic strength: presynaptic elements. Nat. Rev. Neurosci. 2002;3:497–516. - PubMed
    1. Baylor SM, Hollingworth S. Fura-2 calcium transients in frog skeletal muscle fibres. J. Physiol. 1988;403:151–192. - PMC - PubMed
    1. Beaumont V, Zhong N, Froemke RC, Ball RW, Zucker RS. Temporal synaptic tagging by Ih activation and actin: involvement in long-term facilitation and cAMP-induced synaptic enhancement. Neuron. 2002;33:601–613. - PubMed

Publication types

LinkOut - more resources