. 2009 Aug;37(8):937-46.
doi: 10.1016/j.exphem.2009.04.012. Epub 2009 May 27.

Identified hidden genomic changes in mantle cell lymphoma using high-resolution single nucleotide polymorphism genomic array

Affiliations

Identified hidden genomic changes in mantle cell lymphoma using high-resolution single nucleotide polymorphism genomic array

Norihiko Kawamata et al. Exp Hematol. 2009 Aug.

Abstract

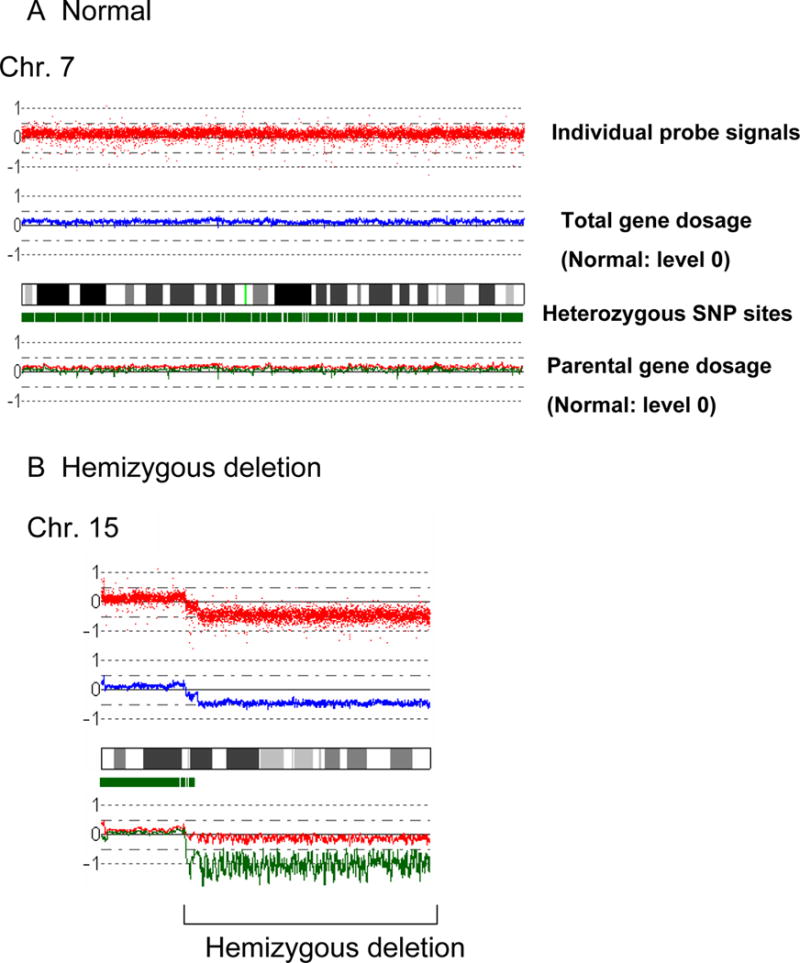
Objective: Mantle cell lymphoma (MCL) is a lymphoma characterized by aberrant activation of CCND1/cyclin D1 followed by sequential genetic abnormalities. Genomic abnormalities in MCL have been extensively examined by classical cytogenetics and microarray-based comparative genomic hybridization techniques, pointing out a number of alterations in genomic regions that correlate with the neoplastic phenotype and survival. Recently, single nucleotide polymorphism genomic microarrays (SNP-chip) have been developed and used for analysis of cancer genomics. This technique allows detection of genomic changes with higher resolution, including loss of heterozygosity without changes of gene dosage, so-called acquired uniparental disomy (aUPD).

Materials and methods: We have examined 33 samples of MCL (28 primary MCL and 5 cell lines) using the 250,000 SNP-chip from Affymetrix.

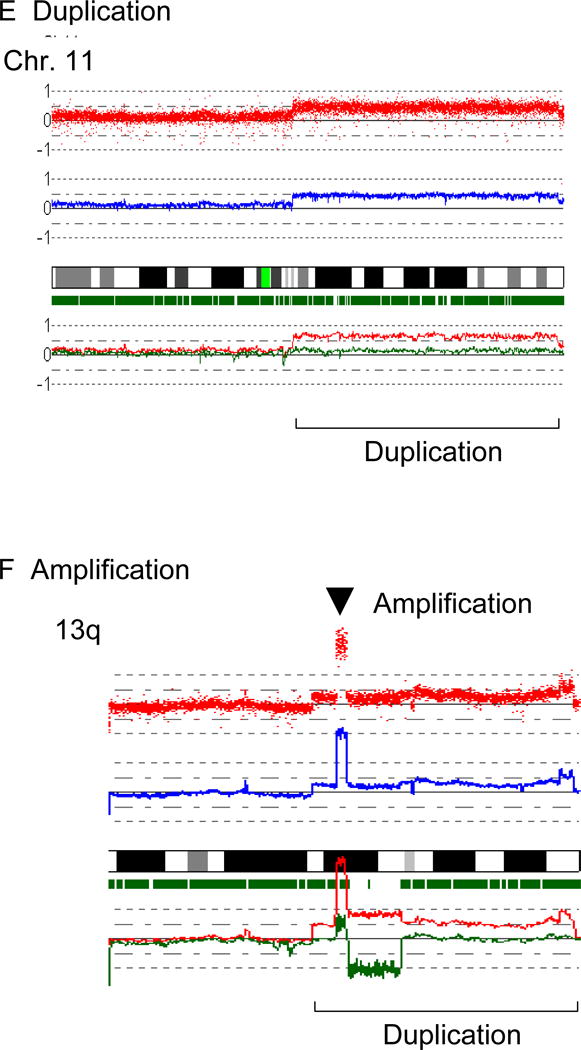
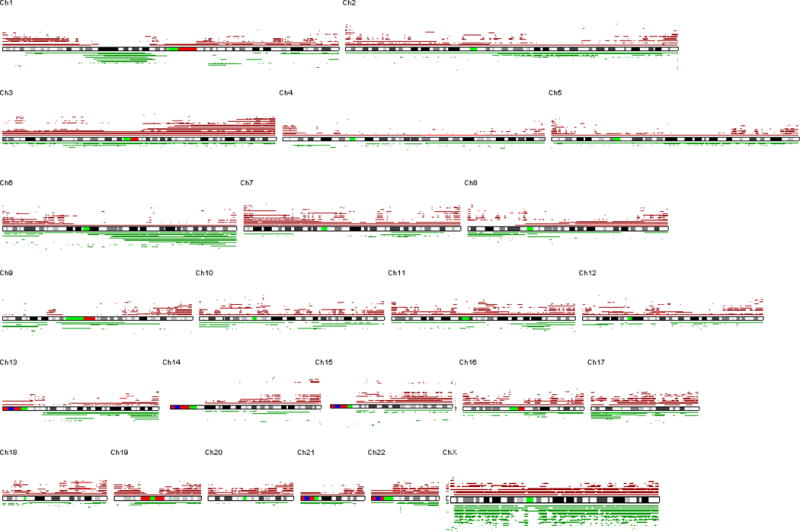
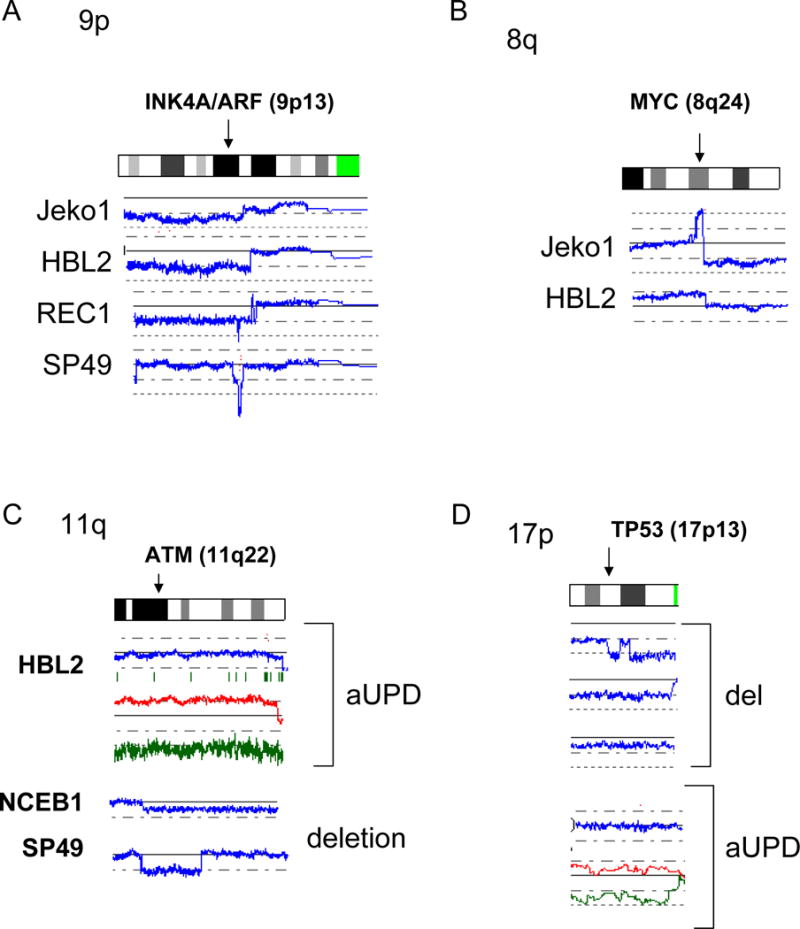
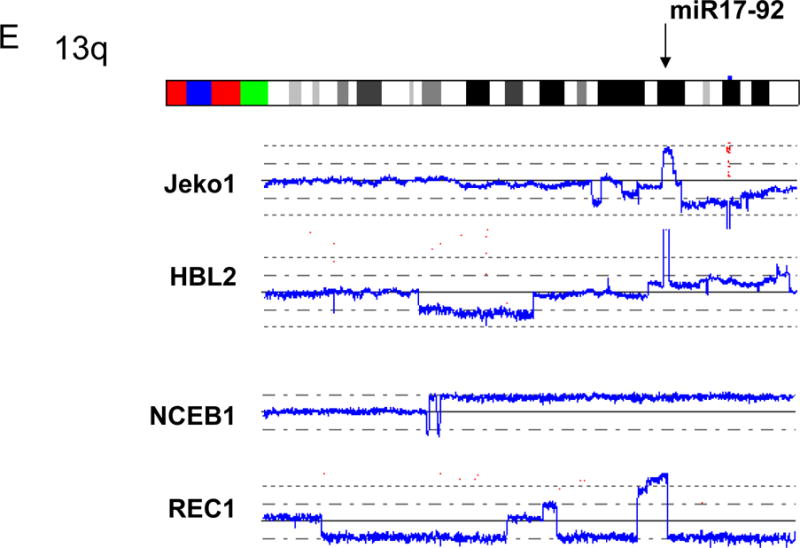
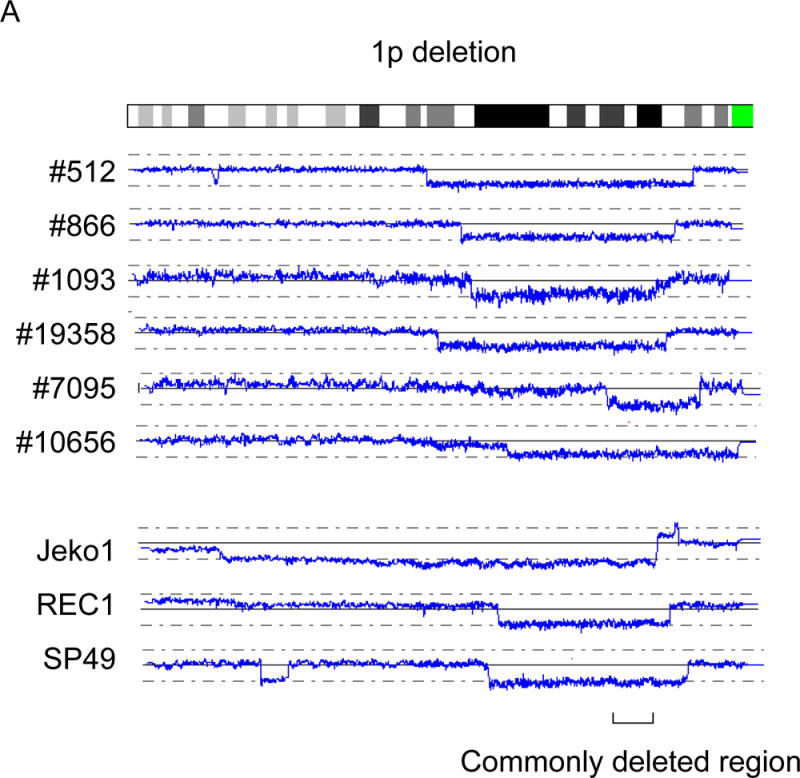
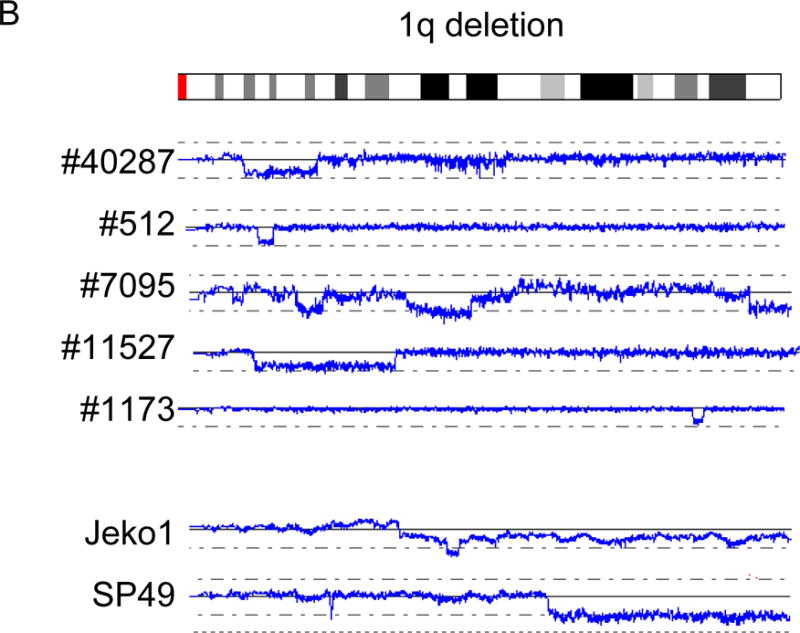
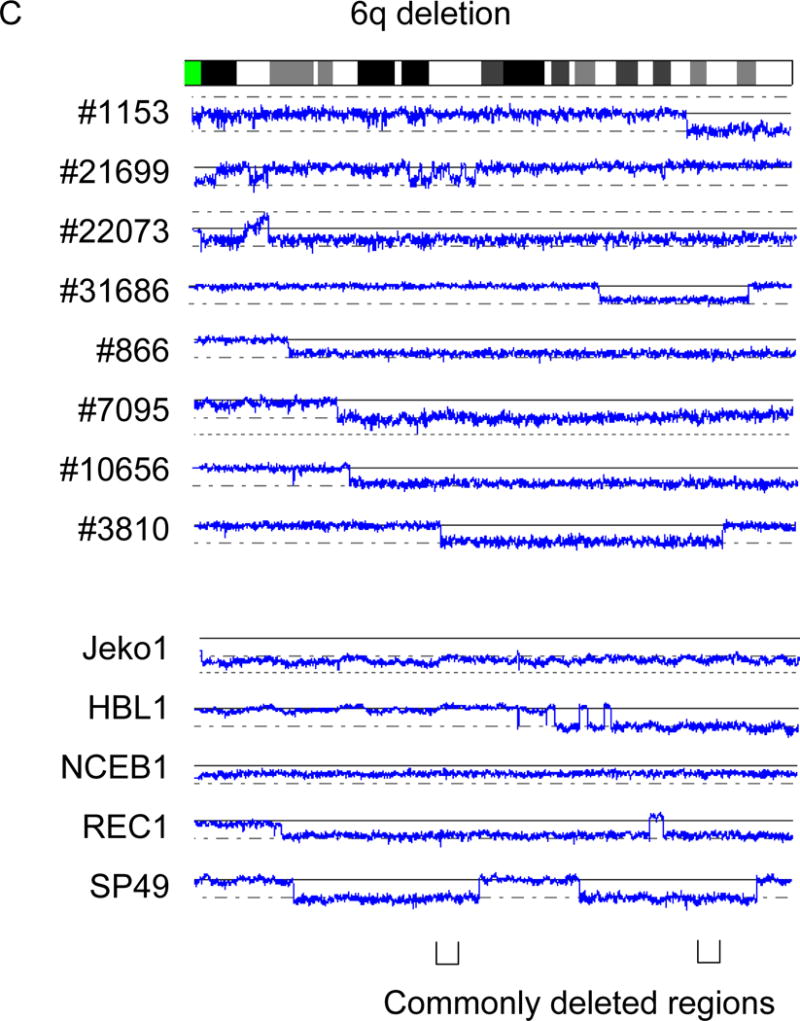
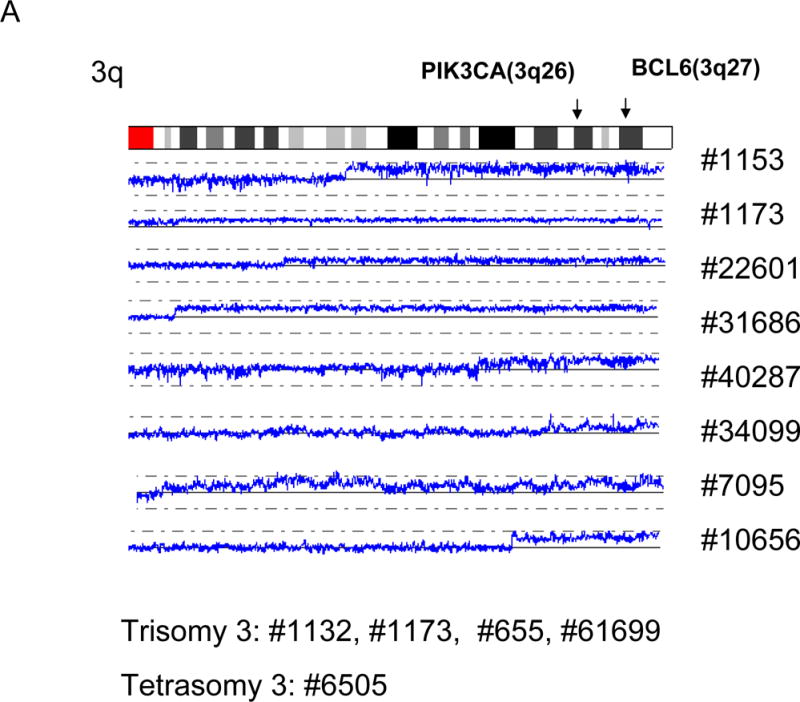
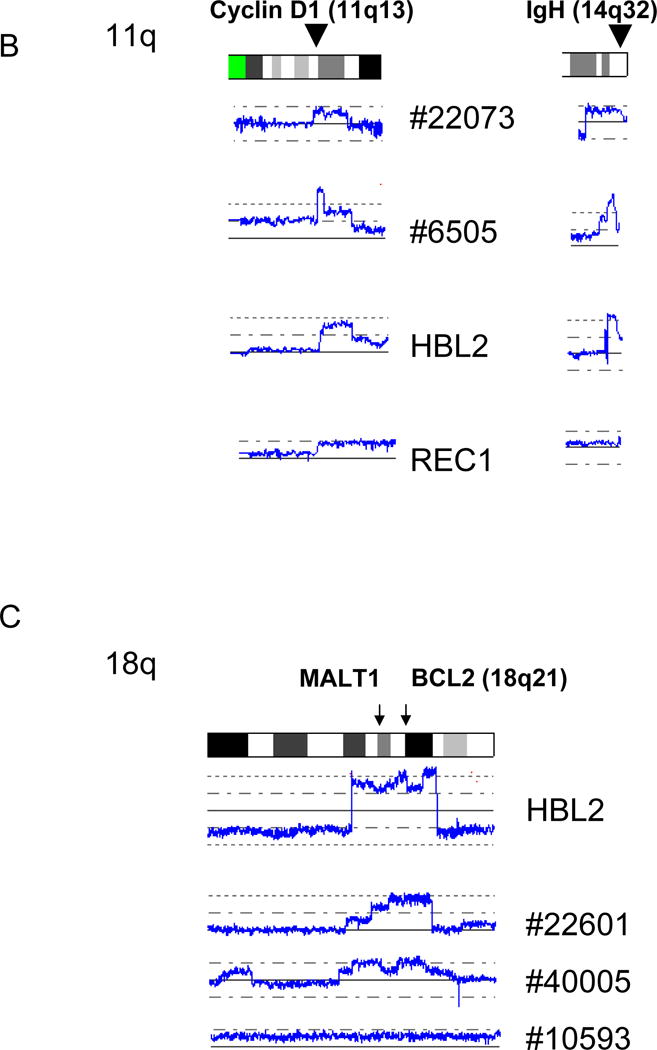
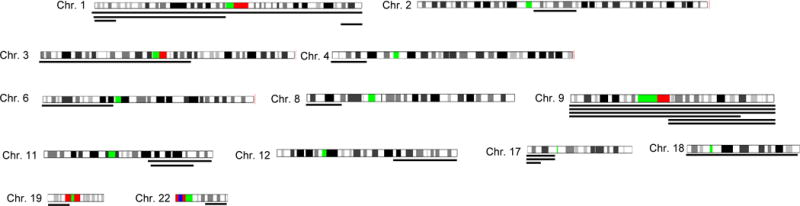
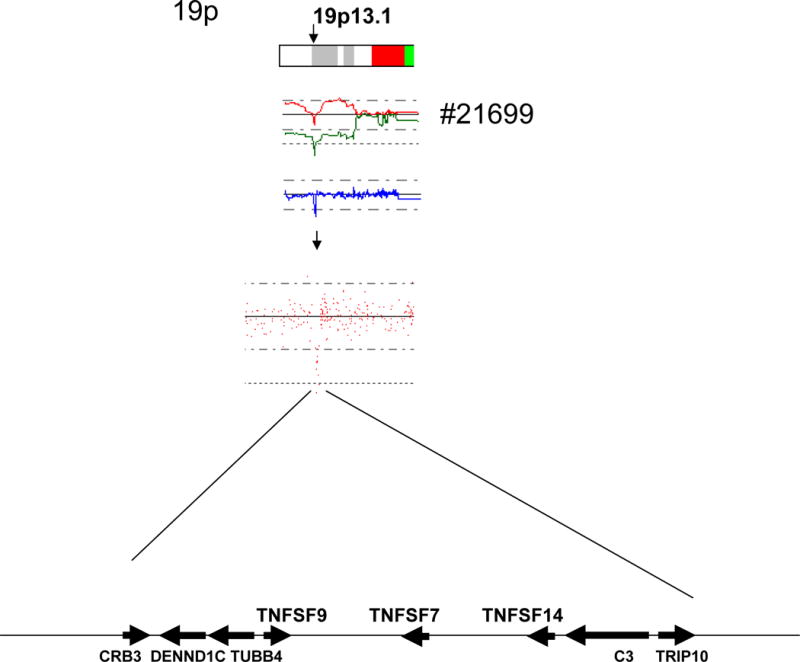
Results: Known alterations were confirmed by SNP arrays, including deletion of INK4A/ARF, duplication/amplification of MYC, deletion of ATM, and deletion of TP53. We also identified a duplication/amplification that occurred at 13q involving oncogenic microRNA, miR17-92. We found other genomic abnormalities, including duplication/amplification of cyclin D1, del(1p), del(6q), dup(3q) and dup(18q). Our SNP-chip analysis detected these abnormalities at high resolution, allowing us to narrow the size of the commonly deleted regions, including 1p and 6q. Our SNP-chip analysis detected a number of aUPD sites, including whole chromosome 9 aUPD and 9p aUPD. We also found an MCL case with 19p, leading to homozygous deletion of TNFSF genes.

Conclusion: SNP-chip analysis detected in MCL very small genomic gains/losses, as well as aUPDs, which could not be detected by more conventional methods.


Conflict of interest statement

No financial interest/relationships with financial interest relating to the topic of this article have been declared.

Figures

Figure 1
Figure 1. Results of SNP-chip analysis
Representative results and the overview of genomic status of 33 MCL identified by SNP-chip are shown. A: Normal chromosome. Top panel shows individual SNP probe signals; intensity of the signals are almost the same over the entire chromosome. Second panel indicates gene dosage level; gene dosage is normal over the chromosome. Third panel shows heterozygosity SNP sites by green rectangles. Heterozygous SNP site are frequently detected over the chromosome. Fourth panel indicates gene dosage of each parental allele (green or red line); level of each allele is identical over the chromosome. B: Hemizygous deletion. Region of hemizygous deletion is delineated by brackets. C: Homozygous deletion. Arrow indicates a site of homozygous deletion; each parental allele (red or green line) has a deletion at this site. D: Acquired uniparental disomy (aUPD). aUPD is a site which has loss of heterozygosity with normal gene dosage; one of the parental alleles is missing (green line) and the other allele is duplicated (red line). aUPD region is indicated by brackets. E: Duplication. Duplicated region is indicated by a parenthesis. F: Amplification. Arrowhead indicates the sites of high copy number amplification. This case also has duplication at 13q as indicated by the brackets. G: SNP-chip data of 33 cases of MCL. Deleted regions are indicated by green lines under each chromosome panel; and duplications/amplifications are indicated by brown lines above each chromosome panel.
Figure 2
Figure 2. Common genomic alterations in MCL
Representative SNP-chip results of common genomic alterations found in MCL are shown. Blue lines indicate gene dosage of each case. A: Deletion of INK4A/ARF (9p13). B: Amplification and duplication of c-MYC (8q24). C: aUPD and deletion of 11q involving ATM. Gene dosages are indicated by blue lines. NCEB1 and SP49 have deletion of 11q22. HBL2 shows normal gene dosage (blue line), but allele-specific gene dosage levels (green and red lines) indicate that one of the parental alleles (green line) is deleted and the other parental allele (red line) is duplicated, suggesting acquired uniparental disomy (aUPD). D: Deletion and aUPD of 17p involving TP53. Top three cases show deletion of 17p13. The bottom case demonstrates normal gene dosage at 17p13 (blue line), but allele-specific gene dosage levels (green and red lines) indicate that one of the parental alleles (green line) is deleted and the other parental allele (red line) is duplicated, suggesting acquired uniparental disomy (aUPD). E: Amplification and duplication of 13q involving miR17-92. Mantle cell lines: Jeko1, HBL2, REC1, SP49, NCEB1. Refer to Supplement Figure 1 and its legend for detailed interpretation of SNP-chip data.
Figure 3
Figure 3. Recurrent deletions in MCL
Recurrent deletions of 1p, 1q and 6q are shown. A: Deletion of 1p. B: Deletion of 1q. C: Deletion of 6q. Commonly deleted regions are indicated by parenthesis. Cell line names and sample numbers are indicated. Blue lines indicate gene dosage levels of each case.
Figure 4
Figure 4. Recurrent duplication/amplification in MCL
A: Duplications of 3q are shown. Positions of PIK3CA (3q26) and BCL6 (3q27) are indicated by arrows. Sample numbers with trisomy 3 and tetrasomy 3 are also shown. B: Amplifications/duplications of cyclin D1 and IgH. The positions of cyclin D1 and IgH are indicated by arrowheads. C: Amplifications/duplications of 18q. Positions of MALT1 and BCL2 are indicated by arrows. Sample numbers and cell line names are shown.
Figure 5
Figure 5. Acquired uniparental disomy in mantle cell lymphoma
Regions of acquired uniparental disomy (aUPD) are shown by lines under each chromosome. Each line under a chromosome reflects a MCL sample. Only the chromosomes having aUPD are shown.
Figure 6
Figure 6. Homozygous deletion of 19p13.3 by acquired uniparental disomy in MCL
Top panel: aUPD was found on 19p leading to homozygous deletion of 19p13.1 in MCL case #21699. Middle panel: SNP-chip probe signals on 19p. Bottom panel: Eight genes involved in homozygous deletion caused by aUPD. TNF superfamily genes (TNFSF 7, 9, 14) are homozygously deleted in this case. Arrows indicate the directions and approximate relative sizes of the genes located in this region.

Similar articles

Cited by

References

    1. Fernàndez V, Hartmann E, Ott G, et al. Pathogenesis of mantle-cell lymphoma: all oncogenic roads lead to dysregulation of cell cycle and DNA damage response pathways. J Clin Oncol. 2005;23:6364–9. - PubMed
    1. Bertoni F, Zucca E, Cotter FE. Molecular basis of mantle cell lymphoma. Br J Haematol. 2004;124:130–40. - PubMed
    1. Weisenburger DD, Armitage JO. Mantle cell lymphoma–an entity comes of age. Blood. 1996;87:4483–94. - PubMed
    1. Meusers P, Hense J, Brittinger G. Mantle cell lymphoma: diagnostic criteria, clinical aspects and therapeutic problems. Leukemia. 1997;11(Suppl 2):S60–4. - PubMed
    1. Witzig TE. Current treatment approaches for mantle-cell lymphoma. J Clin Oncol. 2005;23:6409–14. - PubMed

Publication types