. 2009 Sep 1;47(5):518-28.
doi: 10.1016/j.freeradbiomed.2009.05.021. Epub 2009 May 27.

Chronic ethanol feeding potentiates Fas Jo2-induced hepatotoxicity: role of CYP2E1 and TNF-alpha and activation of JNK and P38 MAP kinase

Affiliations

Chronic ethanol feeding potentiates Fas Jo2-induced hepatotoxicity: role of CYP2E1 and TNF-alpha and activation of JNK and P38 MAP kinase

Xiaodong Wang et al. Free Radic Biol Med. .

Abstract

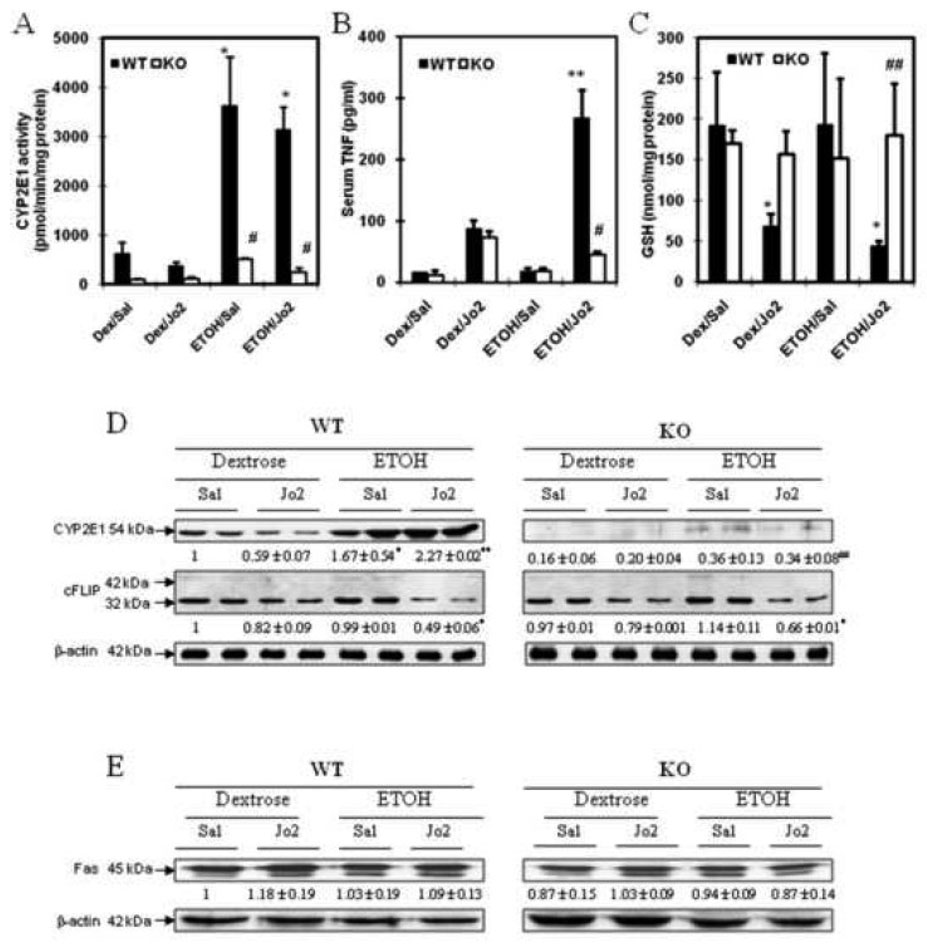
We have previously shown that treatment of mice with pyrazole or acute ethanol potentiated Fas agonistic Jo2 antibody-induced liver injury by a mechanism involving induction of CYP2E1 and elevated oxidative stress. The current study evaluated whether chronic alcohol feeding potentiates Fas-induced liver injury and whether CYP2E1 plays a role in any enhanced hepatotoxicity. Wild-type and CYP2E1 knockout mice were fed ethanol or isocaloric dextrose for 4 weeks followed by a single treatment with either saline or Jo2. Mice were killed 8 h after the Jo2 challenge. There were three- to five fold increases in transaminases and more extensive eosinophilic necrosis, hemorrhage, and infiltration of inflammatory cells in the central zone of the hepatic lobule in the ethanol-fed mice treated with Jo2 compared to the dextrose/Jo2- or ethanol/saline-treated mice. Liver injury was blunted in ethanol-fed CYP2E1 knockout mice treated with Jo2. The chronic ethanol feeding produced steatosis, elevation of CYP2E1, and oxidative stress in wild-type but not CYP2E1 knockout mice. These changes in wild-type mice fed ethanol were similar after saline or Jo2 treatment. The Jo2 treatment produced activation of JNK and P38 MAP kinase, increased activity of caspase-8 and -3, and lowered hepatic GSH levels in both the dextrose- and the alcohol-fed mice. JNK was activated at early times after Jo2 treatment in the ethanol-fed mice. Serum TNF-alpha levels were strikingly elevated in the wild-type ethanol/Jo2 group, which showed liver injury, compared to all the other groups, which did not show liver injury. Inhibition of JNK or P38 MAPK partially, but not completely, prevented the elevated liver injury in the wild-type ethanol/Jo2 mice. These results show that chronic ethanol feeding enhances Fas-induced liver injury by a mechanism associated with induction of CYP2E1, elevated serum TNF-alpha levels, and activation of MAPK.


Figures

Fig. 1
Fig. 1
Levels of serum transaminases and liver histopathology after chronic ethanol feeding plus Jo2 treatment. (A) serum ALT. (B) serum AST. (C) Histopathology. Panels C3 and C4 show steatosis and macrovesicular fat in the hepatic lobule. C4 also shows eosinophilic necrosis, hemorrhage and infiltration of inflammatory cells in the central zone of the hepatic lobule (arrows, HE×200). Panels C7 and C8 show microvesicular fat in the hepatic lobule (arrows, HE×200). C8 shows limited focal eosinophilic necrosis (arrows, HE×200). Panels C2 and C6 show slightly sinusoid dilation and congestion and local eosinophilic necrosis (arrows, HE×200). Panels C1 and C5 no obvious pathological changes. Data are the mean±SD for 4 mice. ** significantly different compared to the WT Dex/Sal or WT Dex/Jo2 group or WT ETOH/Sal, p<0.01. *** significantly different compared to the WT Dex/Sal or WT Dex/Jo2 or WT ETOH/Sal group, p<0.001. ## significantly different compared to the WT ETOH/Jo2 group, p<0.01.
Fig. 2
Fig. 2
Protein carbonyl and MDA adducts. (A) The protein carbonyl level was assayed in liver homogenates using 20 m g of protein samples, and the OxyBlot Protein Oxidation Detection Kit as described in Materials and Methods. The level of protein carbonyl adducts was higher in the WT ETOH/Jo2 and WT ETOH/Sal group compared to WT Dex/Jo2 and WT Dex/Sal group. In the WT ETOH/Jo2 or ETOH/Sal group, the level of protein carbonyl adducts was higher than that in CYP2E1 KO ETOH/Jo2 or ETOH/Sal group. (B) Immunohistochemical staining was performed by using the immunoCruz ABC Kit in paraffin section for MDA with rabbit-anti-MDA antibody. (B3,B4) show strongly positive staining in macrovesicular fat in the WT ETOH /Sal and WT ETOH/Jo2 group (+++, arrows, IHC×200). (B7,B8) show moderately positive staining in microvesicular or macrovesicular fat in the KO ETOH /Sal and KO ETOH/Jo2 group (++, arrows, IHC×200). (B2,B6) show weakly positive staining in microvesicular fat in the WT Dex/Jo2 or KO Dex/Jo2 group (+, arrows, IHC×200). (B1,B5) show negative staining in liver tissue in the WT Dex/Sal or KO Dex/Sal group (−, arrows, IHC×200).
Fig. 3
Fig. 3
CYP2E1 activity and levels of CYP2E1, TNF-α, GSH, cFLIP and FAS. (A) CYP2E1 catalytic activity was measured in liver microsome fractions by evaluating the oxidation of p-nitrophenol to p-nitrocatechol in the presence of NADPH and oxygen. Results are from 4 mice in each group. * significantly different compared to the WT Dex/Sal or WT Dex/Jo2 group, p<0.05. # significantly lower compared to the WT ETOH/Sal or WT ETOH/Jo2 group, p<0.05. (B) Serum TNF-a contents. ** significantly different compared to the WT Dex/Sal or WT Dex/Jo2 or WT ETOH/Sal group, p<0.01. # significantly lower compared to the WT ETOH/Jo2 group, p<0.05. (C) GSH content. * significantly different compared to the WT Dex/Sal or WT ETOH/Sal group, p<0.05. ## significantly different compared to the WT ETOH/Jo2 group, p<0.01. (D) CYP2E1 and cFLIP protein level. The levels of CYP2E1or cFLIP in 20 µg of protein samples from freshly prepared microsome or homogenate fractions were determined by Western blot analysis with anti-CYP2E1 or anti-cFLIP polyclonal antibody. The number below the blots refer to the CYP2E1or cFLIP/p-actin ratio. * significantly different compared to the WT Dex/Sal group, p<0.05. ** significantly different compared to the WT Dex/Sal group and WT Dex/Jo2 group, p<0.01. ## significantly different compared to the WT ETOH/Jo2 group, p<0.01. (E) FAS level. No significant difference.
Fig. 4
Fig. 4
Caspase-8, caspase-3, caspase-6 and caspase-9 activities . The fluorescence associated with cleavage of the proluminescent substrates Z-IETD-AFC, AC-DEVD-AMC, AC-VEID-AFC and AC-LEHD-AFC was determined with a spectrofluorometer based on the amount of released AFC (caspase-8, −6, −9, λex=400, λem=505) or AMC (caspase-3, λex=380, λem=460). The results were expressed as arbitrary units of fluorescence per milligram of protein. (A) Caspase-8 activity in liver tissue. (B) Caspase-3 activity in liver tissue. (C) Caspase-6 activity in liver tissue. (D) Caspase-9 activity in liver tissue. Results are from 4 mice in each group. * significantly different compared to the WT Dex/Sal or WT ETOH/Sal group, p<0.05. # significantly different compared to the KO Dex/Sal or KO ETOH/Sal group, p<0.05.
Fig. 5
Fig. 5
JNK and P38 MAPK activation. The levels of total and phosphorylated forms of JNK and P38 MAPK in 50 µg of fresh liver homogenates were measured by Western blot. Typical blots for two mice are shown and samples/β-actin ratio from 6 mice for each group are shown below the blots. * significantly higher compared Dex/Sal group, p<0.05. ** significantly higher compared Dex/Jo2 group after 2 hrs of Jo2 treatment, p<0.01. # significantly different compared to the ETOH/Jo2 group after 2 hrs of Jo2 treatment, p<0.05. & significantly lower compared to the ETOH/Jo2 group after 8 hrs of Jo2 treatment, p<0.05. && significantly lower compared to the ETOH/ Jo2 group after 8 hrs of Jo2 treatment, p<0.01.
Fig. 6
Fig. 6
Partial protection against hepatoxicity by a JNK or P38 MAPK inhibitor. (A) serum ALT at different time points after addition of Jo2. (B) serum AST at different time points after addition of Jo2. (C) serum ALT after inhibitor treatment. (D) serum AST after inhibitor treatment. (E) Histopathology. E1 shows some steatosis in the hepatic lobule (arrows, HE×200). E2 shows steatosis and slightly sinusoid dilation and congestion in the hepatic lobule (arrows, HE×200). E3 shows steatosis, severe eosinophilic necrosis, hemorrhage and infiltration of inflammatory cells in hepatic lobule (arrows, HE×200). E4 shows steatosis and focal or slightly eosinophilic necrosis in the hepatic lobule (arrows, HE×200). E5 shows steatosis and focal or slightly eosinophilic necrosis in the hepatic lobule (arrows, HE×200). Results are from 6 mice in each group. * significantly different compared to the Dex/Jo2 −2 or −4 h group, p<0.05. ** significantly different compared to the ETOH/Jo2 −2 or −4 h group, p<0.01. # significantly different compared to the ETOH/Jo2 −8 h group, p<0.05. ## significantly different compared to the ETOH/Jo2 −8 h group, p<0.01. & significantly different compared to the ETOH/Jo2 −8 h group, p<0.05.
Fig. 7
Fig. 7
Model for chronic ethanol diet feeding plus Jo2 induced liver toxicity and potential mechanisms.

References

    1. Albano E. Oxidative mechanisms in the pathogenesis of alcoholic liver diseases. Mol. Aspects Med. 2008;29:9–16. - PubMed
    1. Rao RK, Seth A, Sheth P. Recent Advances in Alcoholic Liver Disease I. Role of intestinal permeability and endotoxemia in alcoholic liver disease. Am. J. Physiol. Gastrointest. Liver Physio.l. 2004;286:G881–G884. - PubMed
    1. Rouach H, Fataccioli V, Gentil M, French SW, Morimoto M, Nordmann R. Effect of chronic ethanol feeding on lipid peroxidation and protein oxidation in relation to liver pathology. Hepatology. 1997;25:351–355. - PubMed
    1. French SW, Wong K, Jui L, Albano E, Hagbjork AL, Ingelman-Sundberg M. Effect of ethanol on cytochrome P450 2E1 (CYP2E1), lipid peroxidation, and serum protein adduct formation in relation to liver pathology pathogenesis. Exp. Mol. Pathol. 1993;58:61–75. - PubMed
    1. Polavarapu R, Spitz DR, Sim JE, Follansbee MH, Oberley LW, Rahemtulla A, Nanji AA. Increased lipid peroxidation and impaired antioxidant enzyme function is associated with pathological liver injury in experimental alcoholic liver disease in rats fed diets high in corn oil and fish oil. Hepatology. 1998;27:1317–1323. - PubMed

Publication types

MeSH terms