. 2009 Jun 2;15(6):477-88.
doi: 10.1016/j.ccr.2009.04.002.

Modeling inducible human tissue neoplasia identifies an extracellular matrix interaction network involved in cancer progression

Affiliations

Modeling inducible human tissue neoplasia identifies an extracellular matrix interaction network involved in cancer progression

Jason A Reuter et al. Cancer Cell. .

Abstract

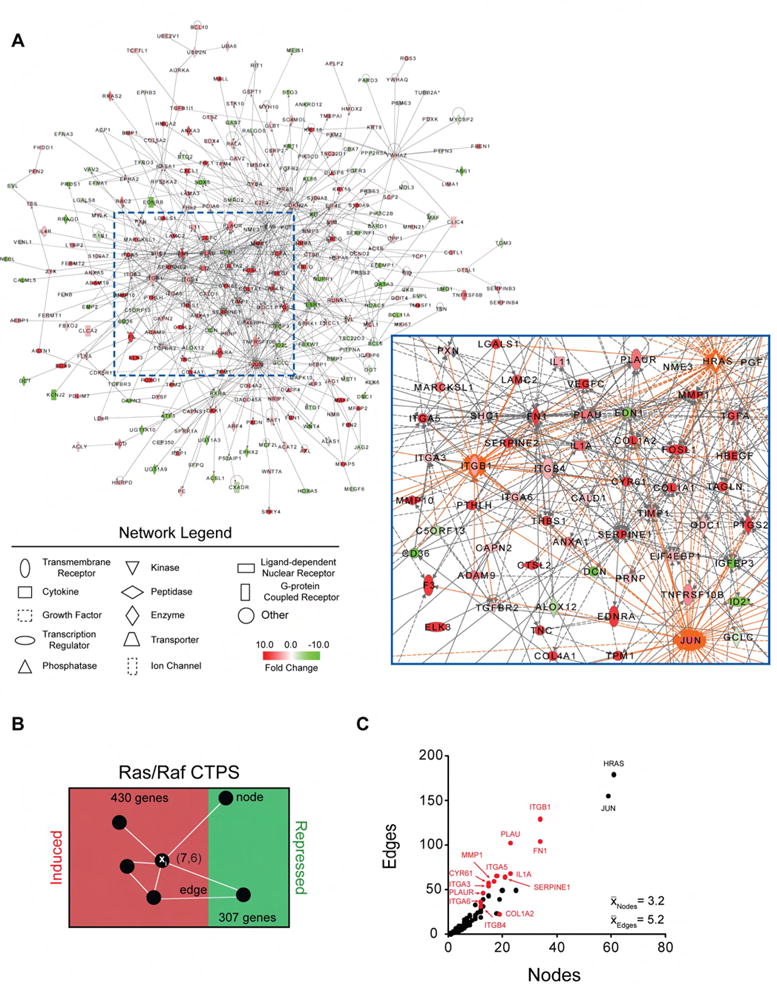
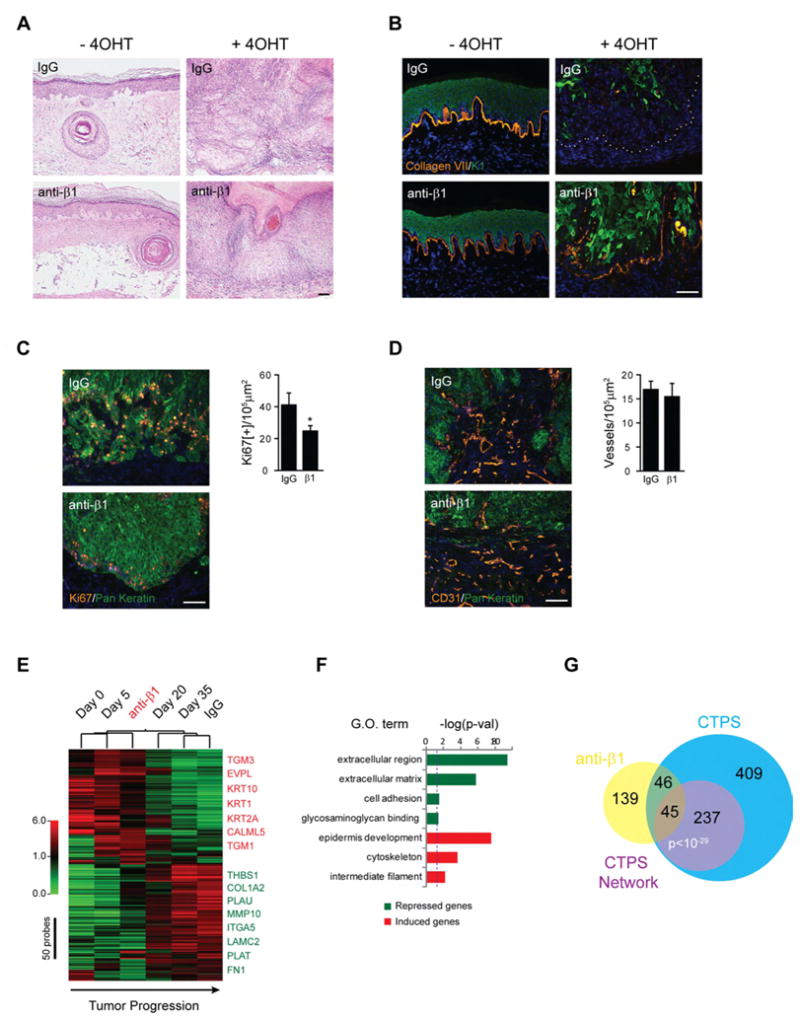
To elucidate mechanisms of cancer progression, we generated inducible human neoplasia in three-dimensionally intact epithelial tissue. Gene expression profiling of both epithelia and stroma at specific time points during tumor progression revealed sequential enrichment of genes mediating discrete biologic functions in each tissue compartment. A core cancer progression signature was distilled using the increased signaling specificity of downstream oncogene effectors and subjected to network modeling. Network topology predicted that tumor development depends on specific extracellular matrix-interacting network hubs. Blockade of one such hub, the beta1 integrin subunit, disrupted network gene expression and attenuated tumorigenesis in vivo. Thus, integrating network modeling and temporal gene expression analysis of inducible human neoplasia provides an approach to prioritize and characterize genes functioning in cancer progression.


Figures

Figure 1
Figure 1. Inducible progression of human tissue neoplasia
(A) Schematic of inducible human tissue neoplasia. (B) Histology of ER:Ras-IκBα regenerated human tissue after the indicated durations of 4OHT treatment. Note the SCC in situ-like disruption of epidermal polarity and differentiation evident by day 10 as well as the progressive invasion of epithelial cells into the underlying stroma from days 20 to 35. Scale bar = 125 μm. Epidermis [E], dermis [D], fat [F], muscle [M], and blood vessels [BV]. (C) Immunostains on tissue from (B) using antibodies against the BM protein, type VII collagen (Col7; orange), and the epithelial marker, Keratin 14 (K14; green). Note the progressive loss of BM integrity as the epithelial cells invade into the underlying dermis. Scale bar = 125 μm.
Figure 2
Figure 2. Tumor and stromal gene expression during tumor progression
(A–B) LCM-mediated microarray analysis of epithelial and stromal RNA isolated from ER:Ras-IκBα grafts after 0, 5, 20, and 35 days of Ras induction. Each time point was done in duplicate. Differentially expressed probes were mean centered, hierarchically clustered, and colored red (induced) and green (repressed) based on a log2 scale. Clustering of the arrays based upon these differentially expressed probes recapitulated the temporal order that the samples were taken during tumor progression. The dendogram at the top represents the extent of similarity among array samples. The bars to the right of the heat map demarcate boundaries between temporal expression clusters. Selected genes for each cluster are color coded and listed to the right of each heat map. (C–D) Graphs illustrating the temporal expression profile for each epithelial or stromal gene cluster are shown (top) as a ratio of the median expression at the indicated time point relative to Day 0. Significantly enriched gene ontology (GO) terms for each cluster are represented in a histogram (bottom) as the −log (p<0.05, Bonferroni corrected EASE score). Redundant terms have been omitted for clarity. Dotted line indicates significance threshold.
Figure 3
Figure 3. Genes co-regulated during Ras- and Raf-driven epidermal neoplasia define a core tumor progression signature (CTPS)
(A) Immunoblots of primary keratinocyte extracts comparing RalA-GTP levels in response to overexpression of RalGDS with 4OHT-mediated Ras activation. RalA-GTP was pulled down by incubation with a RalBD-GST fusion protein. Input cell extract (10%) was probed for total RalA and Actin to verify equal loading. (B) Immunoblots comparing levels of pAKT in response to PI3K-p110α overexpression with 4OHT-induced Ras activation. Actin serves as a loading control. (C) Immunoblots comparing ERK phosphylation induced by either 4OHT-mediated Raf or Ras activity. Actin serves as a loading control. (D–E) Histology (top) of human epidermal tissue co-expressing IκBα and either active RalGDS, PI3K p110α, or Raf:ER 4 weeks post pathway activation. Note the mild hyperplasia in PI3K p110α-IκBα expressing epidermis and invasive neoplasia in 4OHT-treated Raf:ER-IκBα transgenic tissue. Epidermis [E], dermis [D]. Immunostaining (bottom) for Col7 (orange) and Desmoglein-3 (Dsg3, green). Scale bars = 125 μm. (F) Venn diagram illustrating the extent of transcriptional conservation between the Ras and Raf tumor signatures (p-value, Fisher’s Exact test). (G) Heat map representation of Ras/Raf Core Tumor Progression Signature (CTPS). Note that the direction of transcriptional change is conserved between Ras and Raf signatures. (H) Kaplan-Meier survival analysis (p<1.4×10⁻⁸, Cox-Mantel log rank test) on 295 breast cancer samples hierarchically clustered and stratified into two classes based upon similarity to the 737-gene CTPS. Patient tumors classified as “concordant” display a gene expression pattern analogous to that observed in the CTPS, while “discordant” patient tumors do not.
Figure 4
Figure 4. CTPS Network topology identifies oncogene hubs driving tumorigenesis and predicts tumor dependence upon matrix interaction
(A) A literature-based approach was used to generate a network of the physical, enzymatic, and transcriptional interactions between CTPS genes; the largest interconnected subgraph, containing 282 nodes, is shown. Nodes (genes/proteins) within the network are classified by function (shape) and colored red (induced), green (repressed), or gray (not present) based upon Day 35 expression values. Edges are represented as solid or dashed lines to indicate direct and indirect interactions, respectively. The dashed box is enlarged at the lower right. (B) Schematic of the local interconnectivity ranking strategy. A network was generated for each induced CTPS member, Xi, linking it to any remaining members of the CTPS using the Ingenuity Knowledge Base of interactions; for each resultant network the number of nodes and edges were plotted in (C). (C) Interconnectivity plot of the 430 induced genes in the Ras/Raf CTPS. The average number of nodes per gene was 3.2 and the average number of edges was 5.2, with standard deviations of 5.1 and 15.3, respectively. Oncogene hubs (black) and highly interconnected extracellular nodes (red) are labeled.
Figure 5
Figure 5. Expression of integrin subunits and their ligands is temporally induced during neoplastic progression
(A) Immunostaining for differentially transcribed integrin subunits (orange) and K14 (green). Note the loss of polarity as well as the increase in the proportion of cells expressing integrin subunits during tumor progression. The corresponding time course of mRNA expression (top) for each gene is also shown. Scale bar = 125 μm. (B) Immunostaining for the differentially expressed integrin ligands (orange) and K14 (green). TSP1 denotes Thrombospondin-1; scale bar = 125 μm.
Figure 6
Figure 6. The β1 integrin subunit hub is required for tumor growth in both developing and established tumors
(A) Quantitation of β1 integrin expression in SCC tissue microarrays compared to non-invasive SCC in situ patient samples. Tumors were scored based upon the proportion of β1 integrin-positive epithelial cells. (B) Representative immunostains for the data quantitated in (A). Scale bar = 125 μm. (C) Blockade of early tumor progression. Average tumor growth in ER:Ras-IκBα grafts concomitantly treated with 4OHT and anti-β1 or IgG antibody (n=4 mice per group, ±SD). Arrow indicates initiation of antibody treatment. ‘**’ = p<0.005, Student’s t-test. (D) Mean final tumor weight (±SD) from (C). ‘*’ = p<0.05. (E) Inhibition of established tumors. Average growth of Ras-IκBα-Luciferase tumors was monitored via bioluminescence following treatment with anti-β1 or IgG control antibody (n=2 mice per group, ±SD). Arrow indicates initiation of antibody treatment. ‘*’ = p<0.05. (F) Mean final tumor weight (±SD) from (E). ‘**’ = p<0.005.
Figure 7
Figure 7. β1 integrin blockade disrupts CTPS Network gene expression, decreases tumor proliferation, and restores tumor differentiation
(A) Histology of ER:Ras-IκBα grafts ±4OHT and treated with either anti-β1 or IgG antibody for 30 days. Note the reduced hyperplasia, increased polarity, and decreased tumor-stroma intermixing with anti-β1 treatment. Scale bar = 125μm. (B) Expression of the differentiation marker, Keratin 1 (K1, green) and Col7 (orange). Note that anti-β1 treatment partially preserves differentiation and BM protein distribution. Scale bar = 125μm. (C) Immunostaining for the proliferation marker, Ki67 (orange) and pan-Keratin (green). Scale bar = 125μm. Graph depicts the mean number (±SD) of Ki67 positive epithelial cells after the indicated treatment (n=4 grafts per group). ‘*’ = p<0.05, Student’s t-test. (D) Immunostaining for the endothelial marker, CD31 (orange), and pan-Keratin (green). Scale bar = 125μm. Graph depicts the mean vessel density (±SD) after the indicated treatment (n=4 grafts per group). (E) Heat map of the 230 genes altered ≥2-fold by anti-β1-mediated blockade of early tumor progression. LCM was used to isolated tumor RNA from ER:Ras-IκBα grafts co-treated with 4OHT and either anti-β1 or IgG antibody for 30 days. Duplicate array samples were averaged and hierarchically clustered; the dendogram at the top represents the extent of similarity among samples. Selected induced (red) and repressed (green) genes are indicated. Note that anti-β1-treated tumors cluster in between days 5 and 20. (F) Significantly enriched GO terms for genes induced (red) and repressed (green) by β1 blockade are represented in a histogram as the −log (p<0.05, Bonferroni corrected EASE score). Redundant terms have been omitted for clarity. Dotted line represents the significance threshold. (G) Venn diagrams depicting the overlap between: the genes altered with anti-β1 treatment, the Ras/Raf CTPS, and the CTPS Network. Significance was calculated using a Fisher’s Exact test.

Similar articles

Cited by

References

    1. Alam M, Ratner D. Cutaneous squamous-cell carcinoma. N Engl J Med. 2001;344:975–983. - PubMed
    1. Albert R, Jeong H, Barabasi AL. Error and attack tolerance of complex networks. Nature. 2000;406:378–382. - PubMed
    1. Bild AH, Yao G, Chang JT, Wang Q, Potti A, Chasse D, Joshi MB, Harpole D, Lancaster JM, Berchuck A, et al. Oncogenic pathway signatures in human cancers as a guide to targeted therapies. Nature. 2006;439:353–357. - PubMed
    1. Chang HY, Nuyten DS, Sneddon JB, Hastie T, Tibshirani R, Sorlie T, Dai H, He YD, van’t Veer LJ, Bartelink H, et al. Robustness, scalability, and integration of a wound-response gene expression signature in predicting breast cancer survival. Proc Natl Acad Sci U S A. 2005;102:3738–3743. - PMC - PubMed
    1. Chin L, Tam A, Pomerantz J, Wong M, Holash J, Bardeesy N, Shen Q, O’Hagan R, Pantginis J, Zhou H, et al. Essential role for oncogenic Ras in tumour maintenance. Nature. 1999;400:468–472. - PubMed

Publication types

MeSH terms

Associated data