. 2009 Jun 2;15(6):489-500.
doi: 10.1016/j.ccr.2009.03.022.

A gene expression signature associated with "K-Ras addiction" reveals regulators of EMT and tumor cell survival

Affiliations

A gene expression signature associated with "K-Ras addiction" reveals regulators of EMT and tumor cell survival

Anurag Singh et al. Cancer Cell. .

Erratum in

Abstract

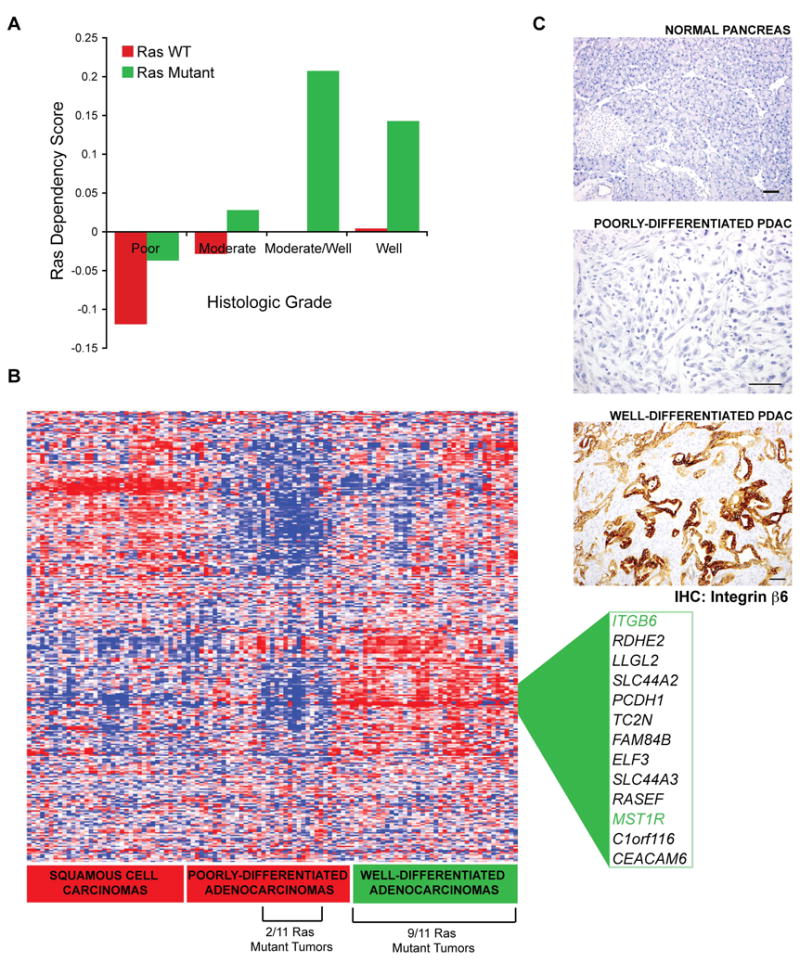
K-ras mutations occur frequently in epithelial cancers. Using short hairpin RNAs to deplete K-Ras in lung and pancreatic cancer cell lines harboring K-ras mutations, two classes were identified-lines that do or do not require K-Ras to maintain viability. Comparing these two classes of cancer cells revealed a gene expression signature in K-Ras-dependent cells, associated with a well-differentiated epithelial phenotype, which was also seen in primary tumors. Several of these genes encode pharmacologically tractable proteins, such as Syk and Ron kinases and integrin beta6, depletion of which induces epithelial-mesenchymal transformation (EMT) and apoptosis specifically in K-Ras-dependent cells. These findings indicate that epithelial differentiation and tumor cell viability are associated, and that EMT regulators in "K-Ras-addicted" cancers represent candidate therapeutic targets.


Figures

Figure 1
Figure 1. Differential K-Ras dependency in human cancer cell lines harboring oncogenic K-Ras
(A) Cell growth assays following lentiviral shRNA-mediated K-Ras ablation using three different K-Ras-directed RNAi sequences (A,B,C) in A549 and H358 lung cancer cell lines. Relative cell densities were determined six days post-infection with the indicated lentiviral shRNAs and pruomycin selection. Error bars represent the standard error of the mean of three independent experiments. Lower panel corresponds to representative 96-well plates in which cell growth was measured in triplicate lentivirus-infected wells. (B) Western blot analysis of lysates from A549 and H358 cells following RNAi-mediated K-Ras knockdown showing effects on K-Ras expression, activation status of ERK and AKT, and cleaved Caspase-3 (Casp-3). p=phospho; t=total. (C) Rescue of K-Ras ablation-induced cell death in H358 cells. Stable lentivirally-transduced cells expressing GFP or HA-K-Ras(12V) were infected with either control, K-RasB or K-RasC shRNA-expressing lentiviruses. The K-RasB shRNA is able to knock down expression of endogenous and exogenous K-Ras, whereas K-RasC only affects endogenous K-Ras. Data are presented as the mean of two independent experiments plus standard error. (D) Rescue of endogenous K-Ras ablation-induced cell death as assessed by both PARP and Caspase-3 cleavage by western blotting. GAPDH provides a protein loading control. Data are representative of two independent experiments.
Figure 2
Figure 2. K-Ras dependency and Caspase-3 induction in K-Ras mutant lung and pancreas adenocarcinoma cell lines
(A) Ras Dependency Indices (RDIs) were calculated as the inverse of the average Relative Cell Densities following K-Ras ablation with the B and C K-Ras shRNAs. RDI values are shown for a panel of lung and pancreatic cancer cell lines and plotted in order of increasing values. Data are presented as the mean and are representative of two or three independent experiments for each cell line. Error bars represent standard error. Assays were performed as described in Figure 1A. (B) Western blot analysis showing Caspase-3 cleavage following K-Ras ablation in cell lines shown in Figure 2A. Total ERK is a loading control. Data are representative of two independent experiments for each cell line. Asterisks denote cell lines classified as being K-Ras-dependent. (C) Quantitation of relative Caspase-3 cleavage following K-Ras ablation with the K-RasC shRNA as assessed by densitometric analysis of cleaved Caspase-3 from blots in Figure 2B. Data are shown as values normalized to cleaved Caspase-3 band density from control shRNA treated cells and presented as the mean of two densitometric readings. Error bars represent standard error.
Figure 3
Figure 3. Associations between K-Ras gene copy number, K-Ras protein overexpression, K-Ras dependency, and epithelial differentiation state
(A) Correlation between RDI values and K-Ras copy number. K-Ras gene copy numbers in a subset of the cell lines shown in Figure 2 were determined by genomic SNP array analysis using Affymetrix Chips. RDI is shown as a function of K-Ras copy number with corresponding p-value and correlation coefficient (r2). (B) Steady-state levels of E-cadherin and K-Ras protein were analyzed by western blotting of lysates from K-Ras-dependent and K-Ras-independent lung and pancreatic cell lines. GAPDH is a gel loading control. Data are representative of two independent experiments. (C) Expression and subcellular localization of E-cadherin and vimentin in K-Ras-independent (red text) and K-Ras-dependent (green text) cell lines, as demonstrated by fluorescence microscopy. Green=E-cadherin; red=vimentin; blue=nuclei (Hoechst). Scale bar = 15 μM. (D) Loss of E-cadherin in H358 cells chronically treated with TGFβ, as demonstrated by fluorescence microscopy. The resulting stable mesenchymal cell line is designated H358M. Green=E-cadherin; red=vimentin. Scale bar = 15 μM. (E) Apoptotic response to shRNA-mediated K-Ras ablation as assessed by western blotting of Caspase-3 cleavage in H358 versus H358M cells. Data are representative of two independent experiments. (F) RDIs for H358 versus H358M cells were derived as described previously. The graph depicts mean RDIs from two independent experiments, with error bars corresponding to standard error.
Figure 4
Figure 4. Mesenchymal-to-epithelial transition and K-Ras dependency
(A) Relationships between Zeb1 and E-cadherin protein expression in a panel of K-Ras-independent and K-Ras-dependent NSCLC cell lines as analyzed by western blotting. GAPDH is a loading control. (B) Expression of Zeb1 and E-cadherin following stable Zeb1 ablation in a polyclonal population of A549 NSCLC and PANC-1 PDAC cells. (C) Expression and subcellular localization of E-cadherin (green) and Zeb1 (red) in control and Zeb1 stable knockdown cells (shZeb1), as assessed by immunofluoresence. Scale bar = 15 μM. (D) Ablation of K-Ras in control versus shZeb1 expressing A549 cells, and effects on apoptosis as assessed by Caspase-3 cleavage. (E) Fold changes in RDI values for A549 and PANC-1 shZeb1-expressing cells. Data are normalized to control shRNA-expressing cells. Data are representative of the mean of two or three independent experiments. Error bars represent standard error.
Figure 5
Figure 5. Derivation of a K-Ras dependency signature
(A) Listing of genes differentially expressed in K-Ras-dependent versus K-Ras-independent cancer cell lines as generated by the PAM algorithm. Bars represent “shrunken centroids”, whose lengths are proportional to average expression of each gene across all cell lines. Red bars correspond to genes expressed at higher levels in K-Ras-independent cells (IND) and green bars correspond to genes expressed at higher levels in K-Ras-dependent cells (DEP). Each instance of a gene in the signature represents a distinct probe set on the microarray platform. Thus, three different SYK probes and two RBM35A probes are differentially represented in the K-Ras-dependency signature. (B) The K-Ras dependency signature is associated with a signature of activated Ras expression in human mammary epithelial cells. The 20 Ras dependency genes most over-expressed upon activated Ras transfection are depicted here. (C) The Ras dependency signature is significantly associated with genes transcriptionally upregulated by activated Ras but not by other activated oncogenes, namely β-catenin, E2F3, Src and Myc. (D) Predictions of K-Ras dependency for a representative “test set” of K-Ras mutant cell lines from various tissue types were made using the PAM algorithm. Nominal RDIs were calculated by plotting growth versus average values for relative K-Ras expression following RNAi, extrapolated from the training set of cell lines. Data are shown as the mean of two independent experiments with error bars representing standard error. Red=K-Ras-independent; green=K-Ras-dependent. Prediction assignments are shown below cell line names. The ‘Dependency Threshold’ of 2.0 established previously is shown as a dashed line. A two-tailed student T-test yielded a p-value of 0.009, demonstrating statistical significance of the predictive value of the K-Ras dependency signature. (E) Heat map showing hierarchical clustering of K-Ras dependency signature gene expression in a cross-tissue panel of K-Ras mutant cell lines. Red and blue indicate relative over or underexpression of genes, respectively. Note the bifurcation of cell lines into two broad groups, with a third subgroup clustering to the leftmost extreme of the heatmap. For cell line names, red=K-Ras-independent lines; green=K-Ras-dependent lines; black= not tested. Tissue of origin is indicated in parentheses: U=Uterus; I=Intestine; P=Pancreas; L=Lung; Bl=Blood; Th=Thymus; S=Stomach; E=Esophagus; Li=Liver.
Figure 6
Figure 6. K-Ras dependency genes are required for viability and epithelial differentiation of K-Ras-dependent cancer cells
(A) Differential expression of the Syk tyrosine kinase, integrin beta6 and the RON receptor tyrosine kinase, β subunit in lung and pancreatic cancer cell lines. Black text=K-Ras-independent; gray text=K-Ras-dependent. Syk expression in BJAB B-lymphocyte cells is a positive control. GAPDH is a gel loading control. Data are representative of two independent experiments. (B) Expression of Syk, Integrin β6 and RON-β proteins following knockdown of K-Ras expression in H358 cells (t-ERK is a gel loading control). (C) Cell growth assays following shRNA-mediated knockdown of three K-Ras dependency genes: SYK, ITGB6 (integrin β6), and MST1R (RON). Data are presented as means and are representative of three independent experiments. Error bars represent standard error. (D) Knockdown of SYK, ITGB6 and MST1R in K-Ras-independent and K-Ras-dependent cells and effects on E-cadherin expression and apoptosis. Caspase-3 induction and E-cadherin expression were analyzed by western blotting, and total ERK (t-ERK) is a loading control. Data are representative of two independent experiments. (E) Correlation between RDI values and IC50 values for R406, a Syk kinase inhibitor, in a panel of K-Ras mutant cancer cell lines. Cells were treated with 0.016 μM to 10 μM R406 for 3 days, and relative cell densities were quantified. Dark grey symbols represent K-Ras-independent lines and light grey represent K-Ras-dependent lines. Data are represented as the mean of two independent experiments. (p-value = 0.0095) (F) Effects R406 on Syk autophosphorylation at Y525/526 (p-SYK) and effects on cell death as assessed by Caspase-3 cleavage. Total Syk (t-Syk) and total Erk (t-ERK) serve as loading controls.
Figure 7
Figure 7. Expression of K-Ras dependency genes is associated with a well differentiated tumor phenotype
(A) The Ras Dependency Score, a measure of average median centered gene expression values of the top ranking K-Ras dependency signature genes, is shown as a function of histologic grading and K-Ras mutation status in a panel of human lung cancer specimens. Green bars=K-Ras mutant tumors, and red bars=tumors with wild-type K-Ras (WT). (B) Hierarchical clustering analysis of gene expression profiles of K-Ras dependency signature genes from the same panel of human lung cancer specimens as in Figure 7A. Two major clusters of overexpressed genes show enrichment for either well-differentiated adenocarcinomas or squamous cell carcinomas, with 9 of 11 K-Ras mutant tumors falling within the well-differentiated adenocarcinoma cluster. Genes differentially expressed in well-differentiated adenocarcinomas are listed and ITGB6 and MST1R, two characterized genes, are highlighted in green. (C) Expression of integrin β6, as assessed by immunohistochemistry in normal mouse pancreatic tissue versus mutant K-Ras driven pancreatic cancers (PDACs), that were classified as either poorly or well-differentiated, based on glandular ductal morphology. Sections were co-stained with hematoxylin. The field shown is representative of 5 high-power fields from independent mouse tumors. The upper and lower panels are shown at 125X magnification, and the middle panel is shown at 250X. Scale bars = 50 μM.

References

    1. Acevedo VD, Gangula RD, Freeman KW, Li R, Zhang Y, Wang F, Ayala GE, Peterson LE, Ittmann M, Spencer DM. Inducible FGFR-1 activation leads to irreversible prostate adenocarcinoma and an epithelial-to-mesenchymal transition. Cancer Cell. 2007;12:559–571. - PubMed
    1. Aguirre AJ, Bardeesy N, Sinha M, Lopez L, Tuveson DA, Horner J, Redston MS, DePinho RA. Activated Kras and Ink4a/Arf deficiency cooperate to produce metastatic pancreatic ductal adenocarcinoma. Genes Dev. 2003;17:3112–3126. - PMC - PubMed
    1. Aguirre AJ, Brennan C, Bailey G, Sinha R, Feng B, Leo C, Zhang Y, Zhang J, Gans JD, Bardeesy N, et al. High-resolution characterization of the pancreatic adenocarcinoma genome. Proc Natl Acad Sci U S A. 2004;101:9067–9072. - PMC - PubMed
    1. Baines AT, Lim KH, Shields JM, Lambert JM, Counter CM, Der CJ, Cox AD. Use of retrovirus expression of interfering RNA to determine the contribution of activated K-Ras and ras effector expression to human tumor cell growth. Methods Enzymol. 2006;407:556–574. - PubMed
    1. Bardeesy N, Cheng KH, Berger JH, Chu GC, Pahler J, Olson P, Hezel AF, Horner J, Lauwers GY, Hanahan D, DePinho RA. Smad4 is dispensable for normal pancreas development yet critical in progression and tumor biology of pancreas cancer. Genes Dev. 2006;20:3130–3146. - PMC - PubMed

Publication types

MeSH terms