. 2009 Jun 2;15(6):514-26.
doi: 10.1016/j.ccr.2009.04.001.

Expression of mutant p53 proteins implicates a lineage relationship between neural stem cells and malignant astrocytic glioma in a murine model

Affiliations

Expression of mutant p53 proteins implicates a lineage relationship between neural stem cells and malignant astrocytic glioma in a murine model

Yuan Wang et al. Cancer Cell. .

Abstract

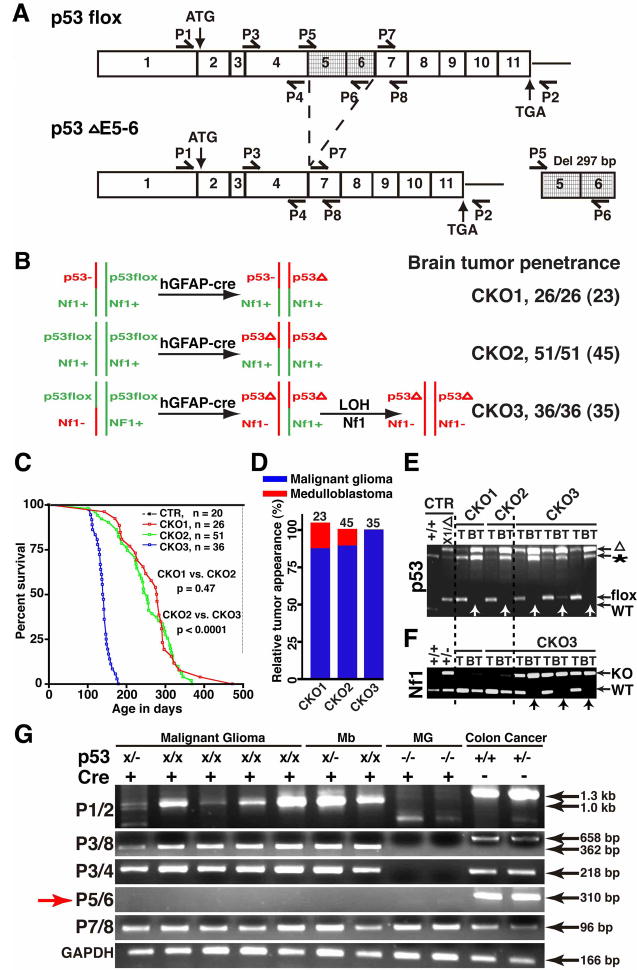
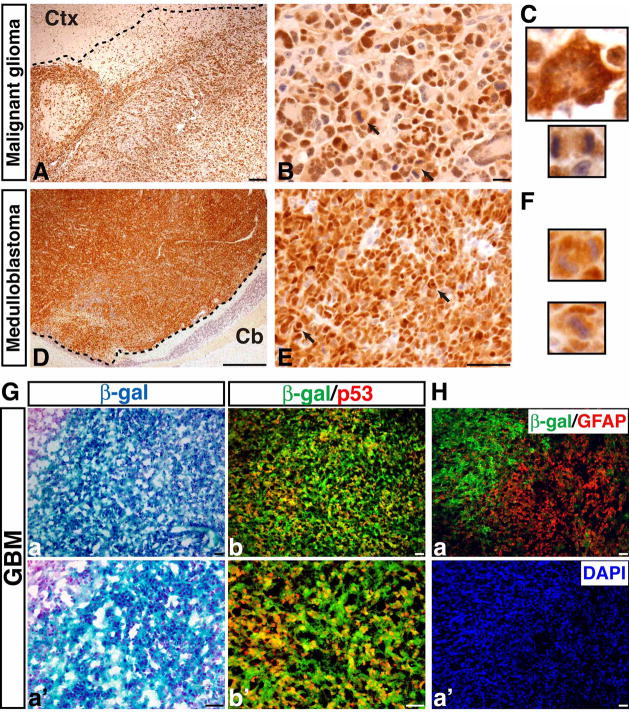
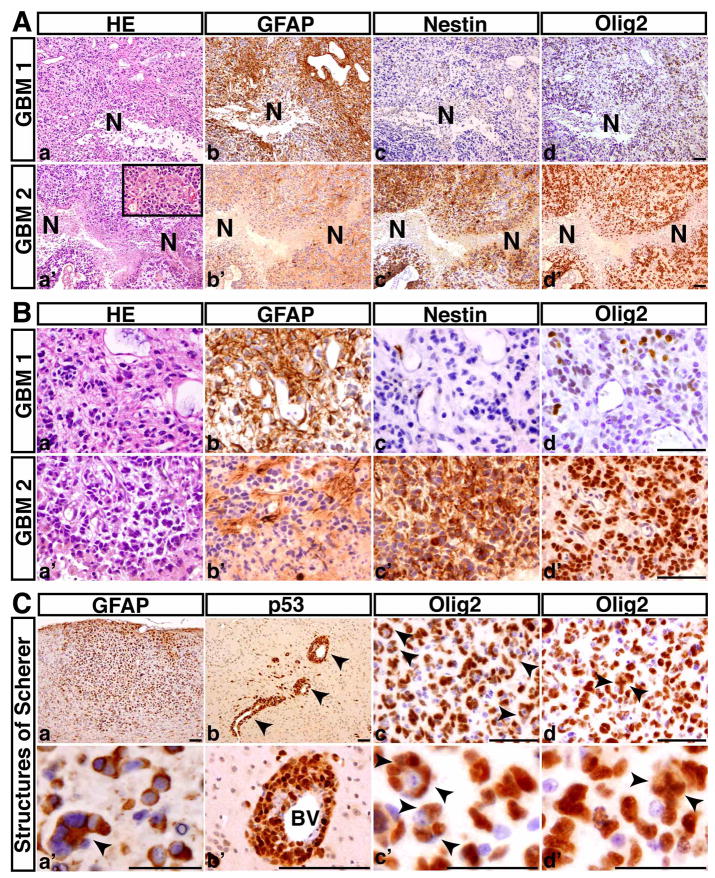
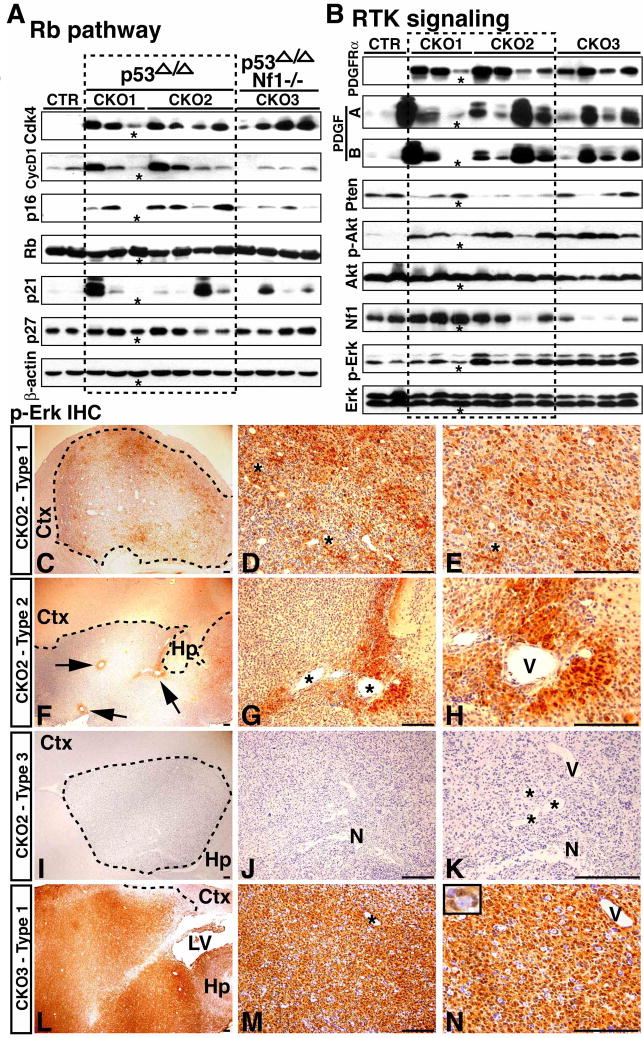
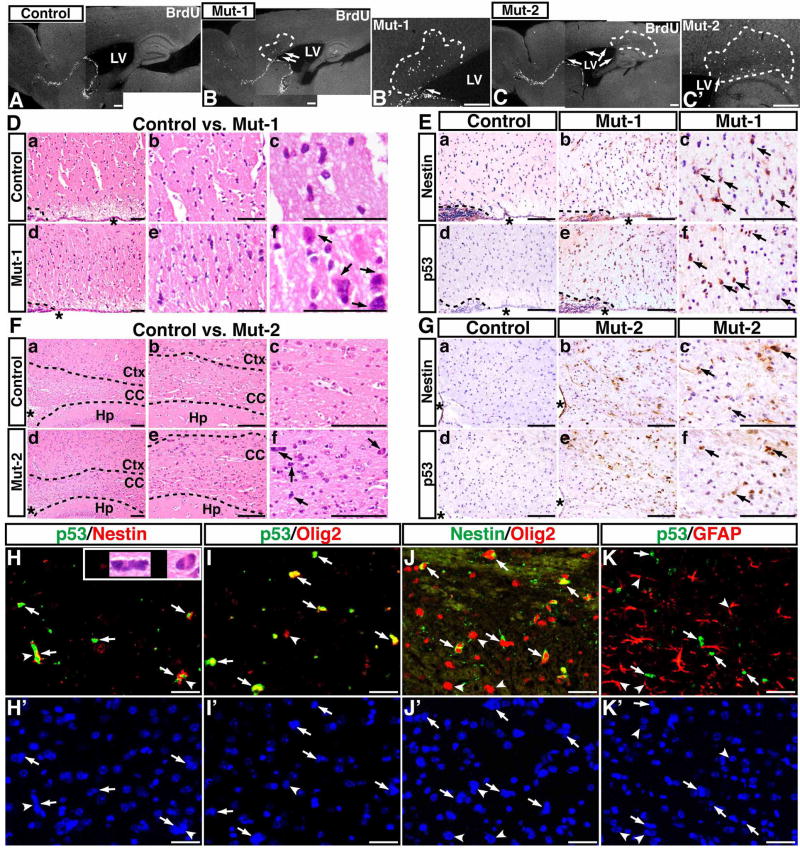
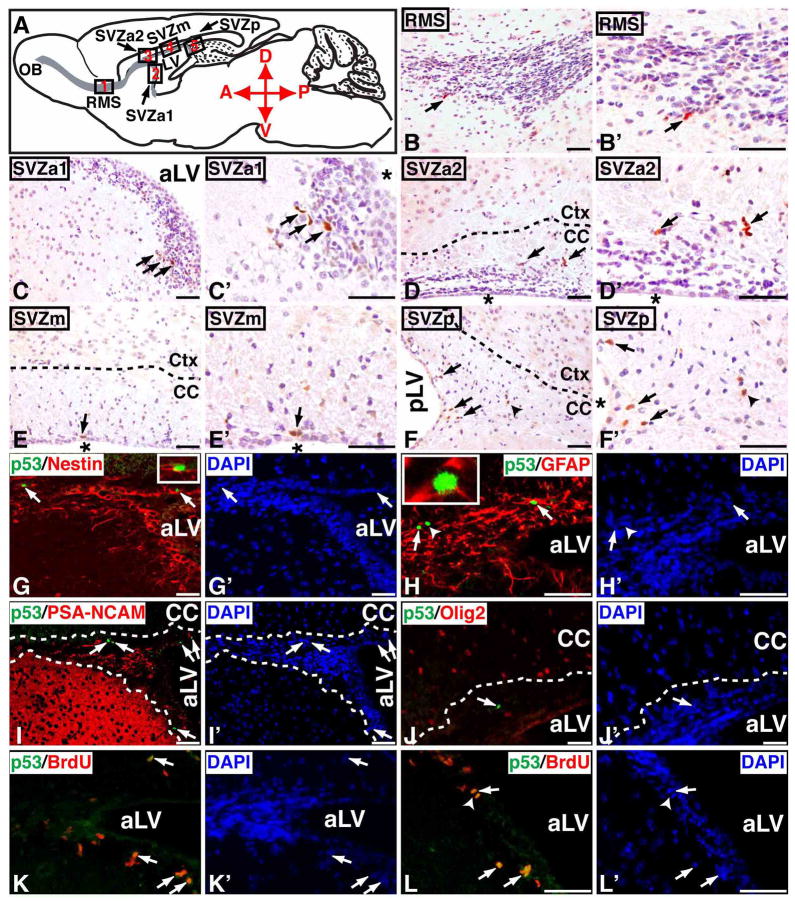
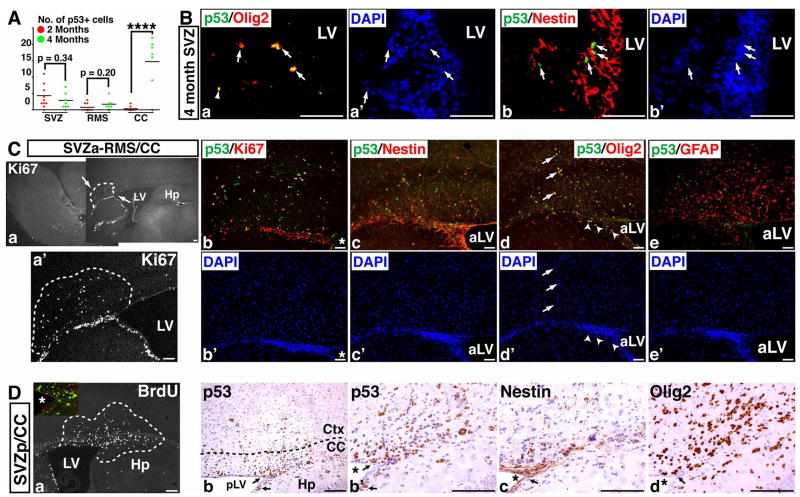
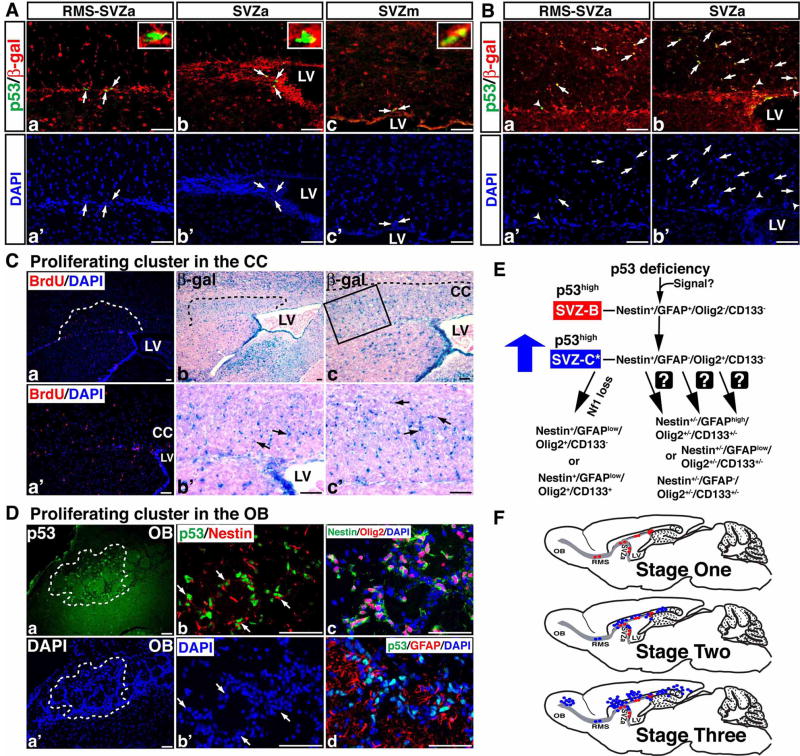
Recent studies have identified genes and core pathways that are altered in human glioblastoma. However, the mechanisms by which alterations of these glioblastoma genes singly and cooperatively transform brain cells remain poorly understood. Further, the cell of origin of glioblastoma is largely elusive. By targeting a p53 in-frame deletion mutation to the brain, we show that p53 deficiency provides no significant growth advantage to adult brain cells, but appears to induce pleiotropic accumulation of cooperative oncogenic alterations driving gliomagenesis. Our data show that accumulation of a detectable level of mutant p53 proteins occurs first in neural stem cells in the subventricular zone (SVZ) and that subsequent expansion of mutant p53-expressing Olig2(+) transit-amplifying progenitor-like cells in the SVZ-associated areas initiates glioma formation.


Figures

Figure 1
Figure 1. Construction and characterization of the CKO1, CKO2 and CKO3 mice
(A) The exon structure of the p53flox and deleted p53ΔE5-6 (Del) alleles and RT-PCR strategy. Positions for the primers, P1-8, are illustrated. (B) Schematic drawing of the genetic configurations of CKO1-3 mice. All the mutant mice analyzed developed brain tumors including those in early stages. The number in parenthesis shows the number of mutant mice that developed high-grade brain tumors. (C) Survival curves of control and CKO1-3 mutant mice. “p” value was obtained from Kaplan/Meier Survival Test. (D) The percentage of malignant astrocytic gliomas and medulloblastomas observed in the mutant mice with high-grade brain tumors. Of note, one of 23 CKO1 mice developed both malignant glioma and medulloblastoma. (E, F) Genomic DNAs isolated from the tails (T) and brain tumors (BT, arrows) of CKO1-3 mice were subjected to PCR analysis for the p53 (E) and Nf1 alleles (F). WT, wild-type allele; flox, p53flox allele; “*”, p53 pseudogene; “Δ”, deleted p53 allele; KO, Nf1 knockout allele. (G) RT-PCR analysis showing an aberrant transcript, lacking exons 5 and 6, produced from the mutant alleles in brain tumors including malignant glioma and medulloblastoma (Mb). The p53 full-length cDNAs were amplified from colon cancers of the Smad3−/− mice, serving as a positive control; the p53-null cDNAs from malignant gliomas (MG) of the hGFAP-cre+;p53KO/KO;Nf1flox/flox; mice were used as a negative control. Of note, the p53-null allele produces a truncated transcript lacking exons1 to 6.
Figure 2
Figure 2. P53ΔE5-6 brain tumors specifically express a detectable level of mutant p53 proteins
Representative examples showing p53ΔE5-6-positive malignant astrocytic gliomas (A, B) and medulloblastomas (D, E). The dashed lines roughly mark the border of the tumors and surrounding brain tissues because of the infiltrating nature of these tumors (A, D). Arrows in (B) and (E) point to mitotic figures in malignant gliomas and nuclear molding in medulloblastomas, respectively. (C) High magnification views of a p53ΔE5-6-positive multinucleated giant cell (upper panel) and mitotic figure (bottom panel) in a malignant glioma. (F) High magnification views of a p53ΔE5-6-positive mitotic figure (upper panel) and nuclear molding (bottom panel) in a medulloblastoma. Ctx, cerebral cortex; Cb, cerebellum. (G) Adjacent sections from p53ΔE5-6 brain tumors harboring the R26R-LacZ transgene were stained with X-gal (a, a′) and anti-β-gal/anti-p53 antibodies (b, b′). All the p53ΔE5-6-positive tumor cells exhibited β-gal expression indicating p53 deficiency. (H) A small population of tumor cells expressed little or no β-gal, but had high levels of GFAP expression (a). Tumor nuclei were counterstained with DAPI (a′). Scale bar: 50 μm.
Figure 3
Figure 3. The p53ΔE5-6 mutant mice develop GBMs
(A) Serial sections from two representative p53ΔE5-6 GBMs (GBM1, 2) were stained with H&E (a, a′), anti-GFAP (b, b′), anti-Nestin (c, c′), and anti-Olig2 (d, d′). N, necrosis. There are regions of coagulation necrosis (a–d), and pseudopalisades of malignant GBM cells adjacent to necrosis (a′-d′). The inset in (a′) shows microvascular proliferation in this GBM. (B) High-magnification views of (A) illustrate that both malignant cells and nuclei are highly pleomorphic. Many GBM cells have substantial cytoplasm and some have eccentric nuclei (a, a′). (C) The p53ΔE5-6 gliomas exhibit the secondary structures of Scherer: accumulation of GFAP-positive tumor cells in the subpial zone of the cerebral cortex (a, a′); perivascular satellitosis (arrowheads) (b, b′); and perineuronal satellitosis (arrowheads, c, c′). (d, d′) The examples of Olig2+ tumor cells with abnormal mitoses (arrowheads). BV, blood vessels. Scale bar, (A, B, Cad), 50 μm; (Ca′-d′), 25 μm.
Figure 4
Figure 4. Molecular characterization of malignant astrocytic gliomas
(A) Western blot analysis of the Rb pathway. Protein extracts from normal forebrain tissues, p53ΔE5-6 gliomas (CKO1, 2) and p53ΔE5-6;Nf1−/− gliomas (CKO3) were analyzed by Western blot analysis using antibodies against components in the G1/S cell cycle regulatory circuits. β-actin was used as a loading control. (B) Western blot analysis of the RTK and mitogenic signaling pathways on the same samples analyzed in (A). A glioma sample marked by “*” was found contaminated with a significant amount of normal tissues. Sections of malignant gliomas marked by dash lines from CKO2 (C-K) and CKO3 (L-N) mice were stained with an anti-p-Erk antibody. Based upon the number and pattern of p-Erk-positive cells, the p53ΔE5-6 gliomas are highly heterogeneous and can be classified into three types: (1) Type 1 tumors have extensive pErk staining (C-E), (2) Type 2 tumors only have a small number of p-Erk-positive cells that are typically found associated with blood vessels (F-H), and (3) Type 3 tumors exhibit no p-Erk staining (I-K). “N” in (J, K) labels necrosis. In contrast, the p53ΔE5-6;Nf1−/− gliomas are relatively homogeneous and exhibit extensive and intense p-Erk staining (L-N). Ctx, cerebral cortex; Hp, hippocampus; LV, lateral ventricle; “V” and “*”, blood vessels. The inset in (N) shows an example of p-Erk-positive cells encircling a neuron. Scale bar, 100 μm.
Figure 5
Figure 5. Expression of mutant p53ΔE5-6 proteins identifies the earliest-stage glioma cells
BrdU staining was performed on sections from age-matched control (A) and two representative p53ΔE5-6 brains that contain proliferation clusters (marked by dashed lines) in the corpus callosum adjacent to the anterior SVZ (B, B′, Mut-1) and to the posterior SVZ (C, C′, Mut-2), respectively. Arrows in (B to C′) point to abnormal proliferating cells in the SVZ. LV, lateral ventricle. (D) The H&E-stained sections from similar areas of control brain (a–c) and the proliferating cluster of Mut-1 brain (d–f) were imaged and shown at three different magnifications. (E) Adjacent sections of the control and Mut-1 brains (D) were stained with anti-Nestin and anti-p53 antibodies. (F, G) Similar morphological and immunohistochemical analyses of (D, E) were performed on control brain and a proliferating cluster of Mut-2 brain. Arrows in (D, F) point to abnormal cells with atypical nuclei in mutant brains. Arrows in (E, G) point to Nestin+ and p53+ cells in mutant brains. “*” in (D to G) denotes the lateral ventricle. The dashed lines in (D, E) and (F) mark the border of the SVZ and corpus callosum, and the border of the corpus callosum and surrounding tissues, respectively. Ctx, cerebral cortex; CC, corpus callosum; Hp, hippocampus. The sections from the proliferating clusters were stained with anti-p53/anti-Nestin (H) and DAPI (H′); anti-p53/anti-Olig2 (I) and DAPI (I′); anti-Nestin/anti-Olig2 (J) and DAPI (J′); anti-p53/anti-GFAP (K) and DAPI (K′). Arrows in (H–K) point to p53ΔE5-6-positive cells. Arrowheads in (J, J′) point to Nestin/Olig2+ cells that are most likely normal glial progenitors or oligodendrocytes. Arrowheads in (K, K′) point to the p53-negative nuclei of GFAP+ cells. The inset in (H) shows atypical nuclei of two p53+/Nestin+ cells (arrowheads). Scale bar, 25 μm.
Figure 6
Figure 6. A minor population of SVZ stem and progenitor cells exhibit a detectable mutant p53ΔE5-6 protein expression in young adult brain
(A) Schematic drawing of the sagittal plane of the adult mouse brain. Except for the dentate gyrus of the hippocampus, all the Nestin+ cells in the adult brain are restrictively located in the SVZ and RMS colored in grey. Different parts of the RMS and SVZ are shown in five designated boxed areas. At 2 months of age, most of the p53ΔE5-6-positive cells (arrows, B to F′) are identified in the adult neurogenic areas, which include the RMS (B, B′), the anterior SVZ (SVZa1, C, C′ and SVZa2, D, D′), medial SVZ (SVZm, E, E′), and posterior SVZ (SVZp, F, F′). The arrowhead in (F, F′) point to a p53ΔE5-6-positive cell in the adjacent corpus callosum. Sections of the anterior SVZ from 2-month-old p53ΔE5-6 mice were stained by anti-p53/anti-Nestin (G) and DAPI (G′); anti-p53/anti-GFAP (H) and DAPI (H′); anti-p53/anti-PSA-NCAM (I) and DAPI (I′); anti-p53/anti-Olig2 (J) and DAPI (J′); and anti-p53/anti-BrdU (K, L) and DAPI (K′, L′). Arrows in (G-L′) point to the p53ΔE5-6-positive cells in the SVZ. An arrowhead in (H, H′) points to a p53ΔE5-6-positive/GFAP-negative progenitor cell. The insets in (G, H) show the high-magnification views of the p53ΔE5-6-positive cells expressing Nestin and GFAP, respectively. Arrowheads in (L, L′) point to a p53ΔE5-6-positive cells during mitosis. aLV and pLV, anterior and posterior lateral ventricle; “*”, lateral ventricle. Scale bar, 25 μm.
Figure 7
Figure 7. A possible lineage relationship between p53ΔE5-6-positive SVZ-B stem cells and SVZ-C* progenitor-like glioma precursors
(A) The quantification of p53ΔE5-6-positive cells in brains of mutant mice at ages of 2 months and 4 months. Each dot represents the quantification from each individual brain. p**** < 0.0001. (B) Sections from a 4-month-old mutant brain were stained with anti-p53/anti-Olig2 (a) and DAPI (a′); and anti-p53/anti-Nestin (b) and DAPI (b′), in which arrows point to p53ΔE5-6-positive cells in the SVZ. (C) One representative mutant brain has proliferating clusters (marked by dashed lines) in the corpus callosum directly associated with the anterior SVZ (a, a′). Sections from this proliferating cluster were stained with anti-p53/anti-Ki67 (b) and DAPI (b′); anti-p53/anti-Nestin (c) and DAPI (c′); anti-p53/anti-Olig2 (d) and DAPI (d′); and anti-p53/anti-GFAP (e) and DAPI (e′). Arrows and arrowheads in (d, d′) point to p53ΔE5-6-positive Olig2+ SVZ-C*-like glioma precursors located in the corpus callosum and SVZ, respectively. (D) Adjacent sections from one proliferating cluster identified in the posterior SVZ (a) were stained with anti-p53 (b, b′), anti-Nestin (c), and anti-Olig2 antibodies (d). Arrows in (b to d) point to p53ΔE5-6-positive glioma precursors inside the SVZ. The inset in (a) shows the high-magnification view of proliferating p53ΔE5-6-positive glioma precursors in the SVZ [BrdU(green)/p53(red)]. aLV and pLV, anterior and posterior lateral ventricle. “*”, lateral ventricle. Scale bar, 100 μm (Ca, Ca′, Da); 50 μm (B, Cb-e′, Db-d).
Figure 8
Figure 8. P53ΔE5-6-positive SVZ stem cells and glioma precursors express the R26R-LacZ
(A) Sections from 2-month-old p53ΔE5-6 brains with the R26R-LacZ transgene were stained with anti-p53/anti-β-gal antibodies (a–c) and were counterstained with DAPI for labeling nuclei (a′-c′). All the p53ΔE5-6-positive cells (arrows) at this age express β-gal of the R26R-LacZ regardless of their location in the RMS, anterior, or medial SVZ (SVZa and SVZm). The insets in (a–c) show the high-magnification views of p53/β-gal double positive cells. (B) Two representative proliferating clusters identified in the corpus callosum adjacent to either the junction of RMS and SVZa (a, a′) or SVZa (b, b′) were sectioned and stained with anti-p53/anti-β-gal antibodies. Within these proliferating clusters, all the p53ΔE5-6-positive glioma precursors in the corpus callosum (arrows) and SVZ (arrowheads) express β-gal of the R26R-LacZ. (C) Adjacent sections of a proliferating cluster were stained by BrdU/DAPI staining (a, a′) and X-gal (b, c). (b′, c′) High-magnification views of the boxed areas shown in (b, c) reveal a group of β-gal-positive cells with atypical nuclei (arrows). LV, lateral ventricle. (D) A mutant brain contains p53ΔE5-6-positive glioma precursors in the OB (a, a′). Sections from this proliferating cluster were stained with anti-p53/anti-Nestin (b) and DAPI (b′), anti-Nestin/anti-Olig2/DAPI (c), and anti-p53/anti-GFAP/DAPI (d). Arrows in (b, b′) point to p53ΔE5-6-positive cells. (E) A model summarizes p53-mediated gliomagenesis (see Discussion for details). (F) The anatomical location of p53ΔE5-6-positive early-stage glioma precursors during tumor development. Red dots, p53ΔE5-6-positive SVZ-B stem cells; blue dots, p53ΔE5-6-positive SVZ-C*-like glioma precursors. Scale bar, 50 μm

References

    1. Alcantara Llaguno S, Chen J, Kwon CH, Jackson EL, Li Y, Burns DK, Alvarez-Buylla A, Parada LF. Malignant astrocytomas originate from neural stem/progenitor cells in a somatic tumor suppressor mouse model. Cancer Cell. 2009;15:45–56. - PMC - PubMed
    1. Brannan CI, Perkins AS, Vogel KS, Ratner N, Nordlund ML, Reid SW, Buchberg AM, Jenkins NA, Parada LF, Copeland NG. Targeted disruption of the neurofibromatosis type-1 gene leads to developmental abnormalities in heart and various neural crest-derived tissues [published erratum appears in Genes Dev 1994 Nov 15;8(22):2792] Genes & Development. 1994;8:1019–1029. - PubMed
    1. Calabrese C, Poppleton H, Kocak M, Hogg TL, Fuller C, Hamner B, Oh EY, Gaber MW, Finklestein D, Allen M, et al. A perivascular niche for brain tumor stem cells. Cancer Cell. 2007;11:69–82. - PubMed
    1. Cho Y, Gorina S, Jeffrey PD, Pavletich NP. Crystal structure of a p53 tumor suppressor-DNA complex: understanding tumorigenic mutations. Science. 1994;265:346–355. - PubMed
    1. Doetsch F, Garcia-Verdugo JM, Alvarez-Buylla A. Cellular composition and three-dimensional organization of the subventricular germinal zone in the adult mammalian brain. J Neurosci. 1997;17:5046–5061. - PMC - PubMed

Publication types

MeSH terms

Substances