. 2009 Aug;20(15):3525-32.
doi: 10.1091/mbc.e09-03-0252. Epub 2009 May 28.

Mitofusins and OPA1 mediate sequential steps in mitochondrial membrane fusion

Affiliations

Mitofusins and OPA1 mediate sequential steps in mitochondrial membrane fusion

Zhiyin Song et al. Mol Biol Cell. 2009 Aug.

Abstract

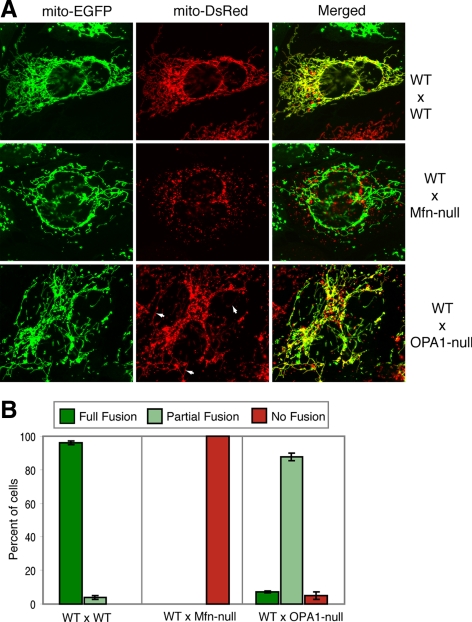
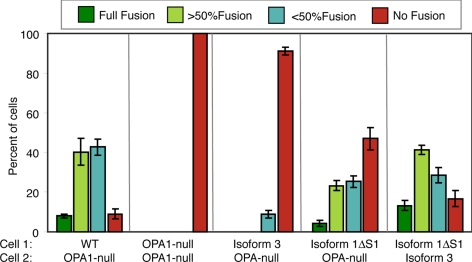
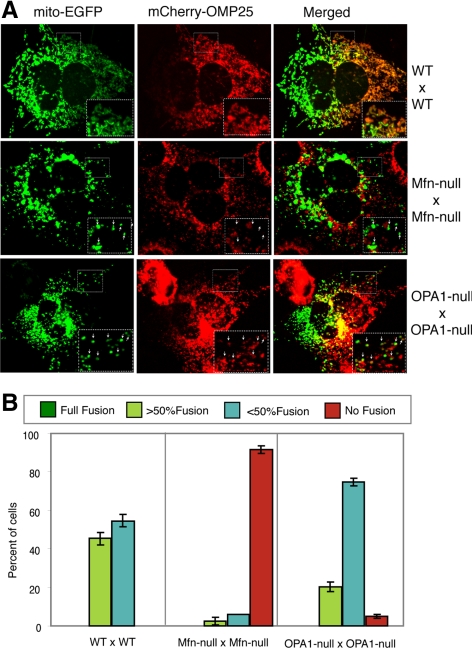
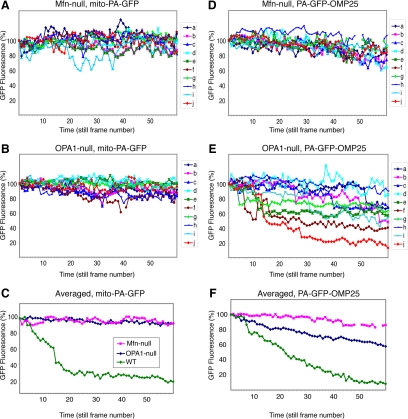
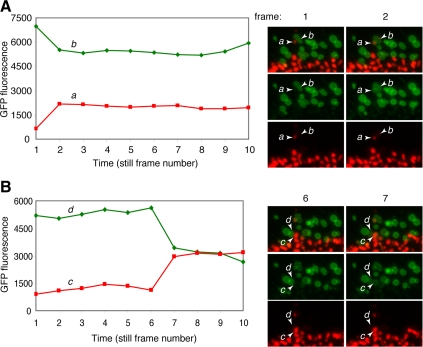
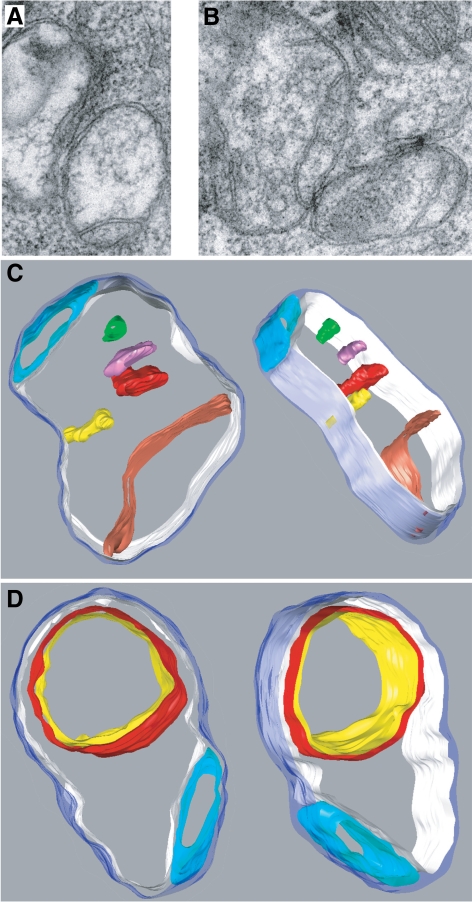
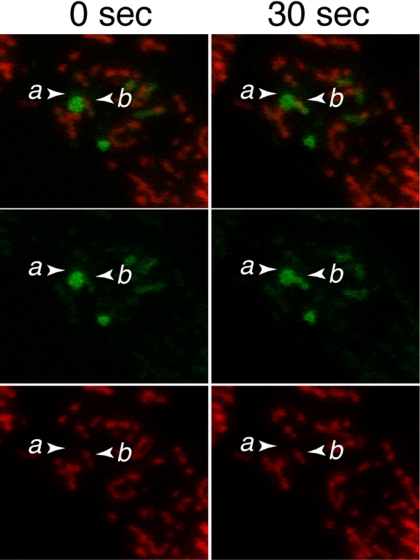
Mitochondrial fusion requires the coordinated fusion of the outer and inner membranes. Three large GTPases--OPA1 and the mitofusins Mfn1 and Mfn2--are essential for the fusion of mammalian mitochondria. OPA1 is mutated in dominant optic atrophy, a neurodegenerative disease of the optic nerve. In yeast, the OPA1 ortholog Mgm1 is required for inner membrane fusion in vitro; nevertheless, yeast lacking Mgm1 show neither outer nor inner membrane fusion in vivo, because of the tight coupling between these two processes. We find that outer membrane fusion can be readily visualized in OPA1-null mouse cells in vivo, but these events do not progress to inner membrane fusion. Similar defects are found in cells lacking prohibitins, which are required for proper OPA1 processing. In contrast, double Mfn-null cells show neither outer nor inner membrane fusion. Mitochondria in OPA1-null cells often contain multiple matrix compartments bounded together by a single outer membrane, consistent with uncoupling of outer versus inner membrane fusion. In addition, unlike mitofusins and yeast Mgm1, OPA1 is not required on adjacent mitochondria to mediate membrane fusion. These results indicate that mammalian mitofusins and OPA1 mediate distinct sequential fusion steps that are readily uncoupled, in contrast to the situation in yeast.


Figures

Figure 1.
Figure 1.
Distinct requirements for mitofusins and OPA1 in mitochondrial fusion. (A) Representative images of three PEG cell hybrid fusion assays done by fusing the parental cells indicated on the right. In the bottom two panels, the mutant cells (Mfn-null or OPA1-null) express mito-DsRed, whereas the wild-type cell (WT) expresses mito-EGFP. In the bottom panel, a cell hybrid between a wild-type and an OPA1-null cell shows extensive mixing of the green (left panel) and red (middle panel) fluorophores. Some elongated mitochondrial tubules containing DsRed in the cell hybrid are indicated by arrows. (B) Quantitation of the PEG cell hybrid experiments. Error bars indicate standard deviations from 3 independent experiments in which 100 cell hybrids were scored. The cell hybrids were scored by estimating the percentage of mitochondria showing colocalization of fluorophores. Full fusion indicates that all the mitochondria in the cell hybrid contained both fluorophores. Cell hybrids with a combination with fused and unfused mitochondria were scored as partial fusion. Hybrids with no doubly stained mitochondria were scored as no fusion.
Figure 2.
Figure 2.
Mitochondrial fusion in hybrids of parental cells with different OPA1 isoforms. Mitochondrial fusion was measured in cell hybrids between wild-type cells, OPA1-null cells, or OPA1-null cells expressing the indicated OPA1 isoforms. Error bars indicate SD from 3 experiments.
Figure 3.
Figure 3.
Outer membrane fusion in OPA1-null cells. (A) Representative images of three PEG cell hybrid fusion assays done by fusing the parental cells indicated on the right and analyzing cells 1 h after cell fusion. Mitochondrial outer membrane mixing was monitored with mCherry-OMP25. In the bottom panel, an OPA1-null cell hybrid shows partial mixing of the green (left panel) and red (middle panel) fluorophores. The large inset is a magnified image of the small box. Arrows highlight individual mitochondria within the inset. (B) Quantitation of the PEG cell hybrid experiments. Scoring and quantitation was done as for Figure 1B, except that because cells only showed partial mitochondrial fusion at 1 h, the partial fusion category was further separated into cells in which greater or <50% of the mitochondria showed fluorophore mixing. Error bars indicate SD from 3 experiments.
Figure 4.
Figure 4.
Behavior of matrix and outer membrane markers in Mfn-null and OPA1-null cells. Full fusion and outer membrane fusion were monitored by measuring the dilution of the matrix marker mito-PA-GFP (A–C) or the outer membrane marker PA-GFP-OMP25 (D–F), respectively, in Mfn-null (A and D) and OPA1-null (B and E) cells. Panels A, B, D, and E show individual normalized fluorescence traces of 10 individual mitochondria every 20 s throughout the entire 20-min recording session. In a few traces, discontinuities are attributable to brief defocusing during recording. The data in A and B are averaged to yield the traces in C. The data in D and E are averaged to yield the traces in F. In E and F, mitochondria from OPA1-null cells demonstrate a much greater decline in PA-GFP-OMP25 fluorescence compared with Mfn-null cells. Data from 6 mitochondria in wild-type cells were used to obtain the wild-type averages in C; data from 5 mitochondria were used to obtain the wild-type averages in F. The legend to F is shown in C.
Figure 5.
Figure 5.
Visualization of outer membrane fusion events in OPA1-null cells. (A) PA-GFP fluorescence traces in a pair of mitochondria in an OPA1-null cell (expressing PA-GFP-OMP25 and mito-DsRed). Mitochondrion b was photoactivated and initially contained high levels of PA-GFP fluorescence. Mitochondrion a was not photoactivated and therefore initially did not show PA-GFP fluorescence. In frame 2, a stepwise drop in the PA-GFP fluorescence of b is matched by an increase the fluorescence of a. Still frames corresponding to these changes are shown on the right. The frames before and after the fluorescence change are shown as a merged (top), green (middle), or red image (bottom). The relevant mitochondria involved in each outer membrane fusion event are labeled. Although exchange of PA-GFP fluorescence occurs, there is no transfer of DsRed. Under our PA-GFP photoactivation conditions, DsRed is photobleached. Therefore, photoactivated mitochondria are easily visualized by high GFP fluorescence and no DsRed fluorescence. (B) Another example similar to A. The still frames shown are from Movies S1 and S2.
Figure 6.
Figure 6.
EM tomography showing multiple matrices in OPA1-null mitochondria. (A and B) Electron micrographs of conventional thin sections showing mitochondria that appear to contain multiple matrix compartments in the mitochondrion at lower right in A and in the mitochondria on the left and lower right in B. (C and D) Views of three-dimensional models calculated from segmented electron tomograms. Both show mitochondria with at least two separate matrix compartments. The outer membrane is rendered in translucent blue. The mitochondrion in (C) contains a large matrix compartment bounded by an inner boundary membrane rendered in white with one large crista rendered in red, a smaller crista in yellow, and three separate membrane compartments in red, magenta, and green that do not connect to the inner boundary membrane within this section; a smaller, separate matrix compartment is rendered in turquoise at the top. The mitochondrion in D contains a smaller matrix compartment rendered in turquoise at the bottom and a larger matrix compartment rendered in white. The latter contains another large compartment bounded by a double membrane rendered in red and yellow.
Figure 7.
Figure 7.
Uncoupled outer membrane fusion in Phb1 knockdown cells. Mito-DsRed and PA-GFP-OMP25 were expressed in wild-type MEFs containing shRNAi for Phb1. In the left panel, mitochondrion a, containing high levels of PA-GFP fluorescence, is adjacent to mitochondrion b, which contains DsRed fluorescence but little PA-GFP fluorescence. In the right panel, 30 s later, PA-GFP fluorescence from a has transferred into b without exchange of DsRed.

References

    1. Alavi M. V., et al. A splice site mutation in the murine Opa1 gene features pathology of autosomal dominant optic atrophy. Brain. 2007;130:1029–1042. - PubMed
    1. Alexander C., et al. OPA1, encoding a dynamin-related GTPase, is mutated in autosomal dominant optic atrophy linked to chromosome 3q28. Nat. Genet. 2000;26:211–215. - PubMed
    1. Chan D. C. Mitochondrial fusion and fission in mammals. Annu. Rev. Cell Dev. Biol. 2006;22:79–99. - PubMed
    1. Chen H., Chomyn A., Chan D. C. Disruption of fusion results in mitochondrial heterogeneity and dysfunction. J. Biol. Chem. 2005;280:26185–26192. - PubMed
    1. Chen H., Detmer S. A., Ewald A. J., Griffin E. E., Fraser S. E., Chan D. C. Mitofusins Mfn1 and Mfn2 coordinately regulate mitochondrial fusion and are essential for embryonic development. J. Cell Biol. 2003;160:189–200. - PMC - PubMed

Publication types

MeSH terms