. 2009 Jul;20(14):3363-73.
doi: 10.1091/mbc.e09-03-0210. Epub 2009 May 28.

Transcriptional analysis of the Candida albicans cell cycle

Affiliations

Transcriptional analysis of the Candida albicans cell cycle

Pierre Côte et al. Mol Biol Cell. 2009 Jul.

Abstract

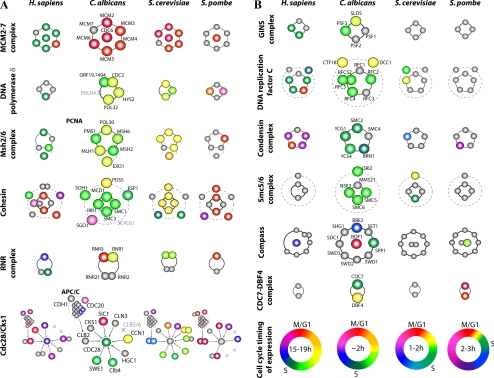
We have examined the periodic expression of genes through the cell cycle in cultures of the human pathogenic fungus Candida albicans synchronized by mating pheromone treatment. Close to 500 genes show increased expression during the G1, S, G2, or M transitions of the C. albicans cell cycle. Comparisons of these C. albicans periodic genes with those already found in the budding and fission yeasts and in human cells reveal that of 2200 groups of homologous genes, close to 600 show periodicity in at least one organism, but only 11 are periodic in all four species. Overall, the C. albicans regulatory circuit most closely resembles that of Saccharomyces cerevisiae but contains a simplified structure. Although the majority of the C. albicans periodically regulated genes have homologues in the budding yeast, 20% (100 genes), most of which peak during the G1/S or M/G1 transitions, are unique to the pathogenic yeast.


Figures

Figure 1.
Figure 1.
Determination of C. albicans cell cycle phases after synchronization. The C. albicans cell cycle was synchronized by mating pheromone treatment and release and was monitored by FACS analysis and by DAPI/calcofluor staining. FACS analysis allows the determination of DNA content per nucleus, associating the 2N and 4N peaks, respectively, as hallmarks of the G1 and G2 phases of the cell cycle. The S phase is extrapolated by ModFit LT (Verity Software House). DAPI/calcofluor staining was used to detect the beginning of mitosis, septation and bud formation (M, M/G1, and early G1, respectively). Representative pictures are shown with their associated term and percentage of the culture population. The color-coded gradient of the cell cycle phases combines both FACS and staining information. DAPI/calcolfuor bar, 3 μm.
Figure 2.
Figure 2.
Gene expression profile of the C. albicans cell cycle. Left to right, phaseogram representing transcript level ratios of the 494 cell cycle-regulated genes (y-axis) collected at each of the seven time points (30-min intervals; x-axis). Levels of expression ratios are color coded as follows: yellow (induced), blue (repressed) and gray (no data). The colored bar adjunct to the expression profile reflects our clustering of genes into four major waves of expression (red, G1/S; blue, S/G2; green, G2/M; and orange, M/G1). Representative expression patterns of 30 genes per cluster are illustrated further on the right. The associated table describes for each cluster—the major gene onthology terms, keynote genes, transcription regulatory motifs found, their significance (in C. albicans only and in Candida clade), and the transcription factor known to bind these motifs. In the keynote genes section, cell cycle regulators are underlined and transcription factors are in bold and underlined. A complete list of C. albicans periodically regulated genes can be found in Supplemental Table 1. For p value calculation details, see Materials and Methods. Candida clade includes the following species: C. albicans, C. tropicalis, C. parapsilopsis, D. hansenii, C. guillimondii, L. elongisporus, and C. lusitanie.
Figure 3.
Figure 3.
Periodical expression is significantly conserved in pairwise but not in common-to-all comparisons. (A) Four-way diagram representing the periodically expressed groups of genes that have homologues in all the four species. To be periodic, a group had to have at least one of its protein members periodically expressed in at least one species. For common-to-all periodically expressed groups, see associated text. (B) Periodically conserved pairwise significance correlation. Despite phylogenetic distances, each pairwise combination of species shares a highly significant group of homologous genes that are periodically regulated (random correlation, 28 groups; p = 1.00 × 10−02). A noticeable exception to this general observation is the human-fission yeast pair that share only 34 groups in common (p = 1.06 × 10−03). Pairwise conserved groups of genes are indicated in the white rectangle.
Figure 4.
Figure 4.
Dynamic regulation of protein complexes through various subunits in each organism. Selected core and derivative protein complexes (solid and dashed rings, respectively) and their subunits (circles); aligned on the same line are sequence orthologues believed to perform the same function. Transcriptionally regulated subunits are colored according to their approximate time of peak expression (B, bottom) or in gray if they are constitutively expressed. (A) Transcriptional dynamics of subunits evolutionarily conserved in at least three of the four organisms. (B) Unexpected differential regulation of protein complexes among the three yeast species. Peak time of transcriptional expression is color coded according to each cell cycle phase and uses the color code of Jensen et al. (2006). For protein complex subunit names and peak of expression, see Supplemental Table 4.
Figure 5.
Figure 5.
Timing coordination of the yeast cell cycle transcriptional regulatory network. Each curve represents a specific motif enrichment detected in periodic genes that reach their peak of expression within a 10% window around every time point. Motif confidence (p value; see Materials and Methods) was determined for every fraction of the cell cycle (resized from 1 to 100%). A color code for each motif is used for every organism: Ace2 in red, G1/S regulatory elements in various greens (MCB, regular green; MCB-td, light green; and SCB, dark green), Fkh2 in blue, Mcm1 in gray, and ECB in orange. The y-axis has the confidence scale in log10, and the x-axis the cell cycle progression (in percentile). Finally, the approximate divisions of cell cycle phases are displayed for each organism. Cut-off threshold, p > 10−05, is indicated by the black dashed line.
Figure 6.
Figure 6.
DNA replication checkpoint pathways in different organisms. DNA replication block-induced response pathway, including sensors and transducers, is conserved from yeast to humans. Components of the pathway (circles) on the same line are sequence orthologues believed to perform the same function. Dashed circles represent potential components yet to be directly linked to the response pathway. In the three fungi, MCB elements found at DNA replication checkpoint cascade components are marked by a black star: a single star for a MCB element and two stars for MCB-tandem motif. Periodically transcribed subunits are colored according to their approximate time of peak expression (bottom) or in gray if they are constitutively expressed.

Similar articles

Cited by

References

    1. Bachewich C., Nantel A., Whiteway M. Cell cycle arrest during S or M phase generates polarized growth via distinct signals in Candida albicans. Mol. Microbiol. 2005;57:942–959. - PubMed
    1. Bähler J. Cell-cycle control of gene expression in budding and fission yeast. Annu. Rev. Genet. 2005;39:69–94. - PubMed
    1. Bar-Joseph Z., Siegfried Z., Brandeis M., Brors B., Lu Y., Eils R., Dynlacht B. D., Simon I. Genome-wide transcriptional analysis of the human cell cycle identifies genes differentially regulated in normal and cancer cells. Proc. Natl. Acad. Sci. USA. 2008;105:955–960. - PMC - PubMed
    1. Bennett R. J., Johnson A. D. The role of nutrient regulation and the Gpa2 protein in the mating pheromone response of C. albicans. Mol. Microbiol. 2006;62:100–119. - PubMed
    1. Berman J. Morphogenesis and cell cycle progression in Candida albicans. Curr. Opin. Microbiol. 2006 - PMC - PubMed

Publication types

LinkOut - more resources