

Probabilistic retrieval and visualization of biologically relevant microarray experiments
- PMID: 19477980
- PMCID: PMC2687969
- DOI: 10.1093/bioinformatics/btp215
Probabilistic retrieval and visualization of biologically relevant microarray experiments
Abstract
Motivation: As ArrayExpress and other repositories of genome-wide experiments are reaching a mature size, it is becoming more meaningful to search for related experiments, given a particular study. We introduce methods that allow for the search to be based upon measurement data, instead of the more customary annotation data. The goal is to retrieve experiments in which the same biological processes are activated. This can be due either to experiments targeting the same biological question, or to as yet unknown relationships.
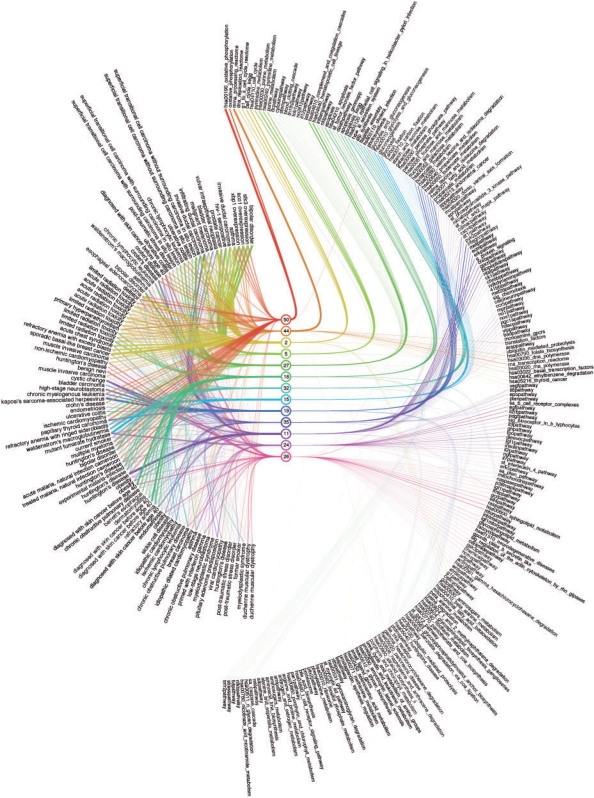
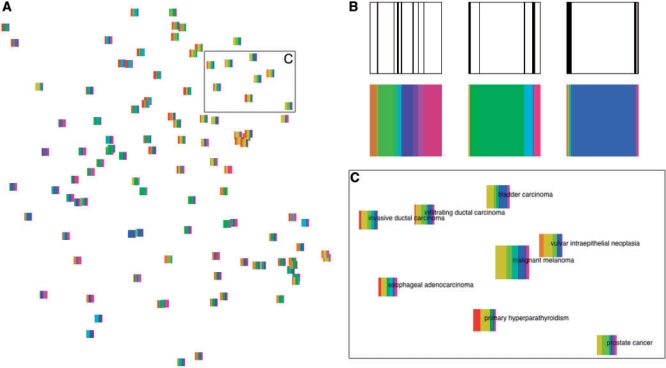
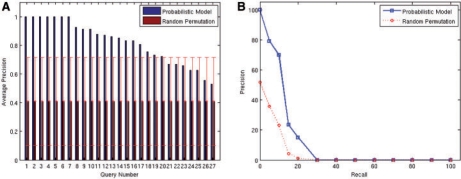
Results: We use a combination of existing and new probabilistic machine learning techniques to extract information about the biological processes differentially activated in each experiment, to retrieve earlier experiments where the same processes are activated and to visualize and interpret the retrieval results. Case studies on a subset of ArrayExpress show that, with a sufficient amount of data, our method indeed finds experiments relevant to particular biological questions. Results can be interpreted in terms of biological processes using the visualization techniques.
Availability: The code is available from http://www.cis.hut.fi/projects/mi/software/ismb09.
Figures

References
-
- Au WY, et al. Cough mixture abuse, folate deficiency and acute lymphoblastic leukemia. Leukemia Res. 2009;33:508–509. - PubMed
-
- Blei D, Lafferty J. A correlated topic model of science. Ann. Appl. Stat. 2007;1:17–35.
-
- Blei D, et al. Hierarchical topic models and the nested Chinese restaurant process. In: Thrun LSS, Schölkopf B, editors. NIPS 16. Cambridge, MA: MIT Press; 2003.
-
- Blei D, et al. Latent Dirichlet allocation. J. Mach. Learn. Res. 2003;3:993–1022.
-
- Buntine W, Jakulin A. Applying discrete PCA in data analysis. In: Chickering DM, Halpern JY, editors. UAI'04. Arlington, Virginia: AUAI Press; 2004. pp. 59–66.
Publication types
MeSH terms
LinkOut - more resources
Full Text Sources
Other Literature Sources
