. 2009 Jun 15;25(12):i154-60.
doi: 10.1093/bioinformatics/btp233.

Proteome coverage prediction with infinite Markov models

Affiliations

Proteome coverage prediction with infinite Markov models

Manfred Claassen et al. Bioinformatics. .

Abstract

Motivation: Liquid chromatography tandem mass spectrometry (LC-MS/MS) is the predominant method to comprehensively characterize complex protein mixtures such as samples from prefractionated or complete proteomes. In order to maximize proteome coverage for the studied sample, i.e. identify as many traceable proteins as possible, LC-MS/MS experiments are typically repeated extensively and the results combined. Proteome coverage prediction is the task of estimating the number of peptide discoveries of future LC-MS/MS experiments. Proteome coverage prediction is important to enhance the design of efficient proteomics studies. To date, there does not exist any method to reliably estimate the increase of proteome coverage at an early stage.

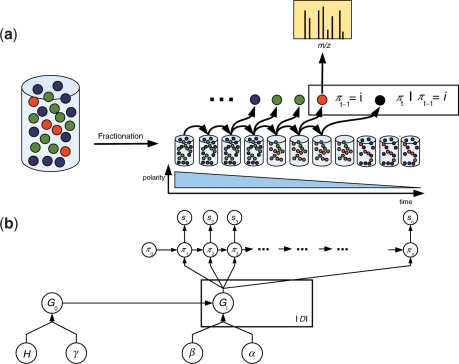
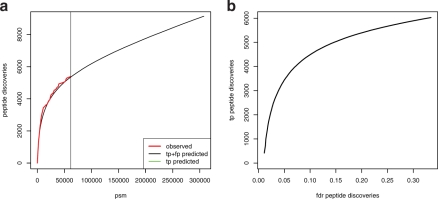
Results: We propose an extended infinite Markov model DiriSim to extrapolate the progression of proteome coverage based on a small number of already performed LC-MS/MS experiments. The method explicitly accounts for the uncertainty of peptide identifications. We tested DiriSim on a set of 37 LC-MS/MS experiments of a complete proteome sample and demonstrated that DiriSim correctly predicts the coverage progression already from a small subset of experiments. The predicted progression enabled us to specify maximal coverage for the test sample. We demonstrated that quality requirements on the final proteome map impose an upper bound on the number of useful experiment repetitions and limit the achievable proteome coverage.


Figures

Fig. 1.
Fig. 1.
Illustration of an LC-MS/MS experiment. (a) Liquid chromatography fractionation generates a sequence of local peptide ensembles from the initial ensemble. Each of these ensembles is derived from the initial ensemble by pooling peptides of similar polarity. The sequence of ensembles features descending overall polarity in the course of the experiment. During the experiment peptides πt are drawn from the sequence of ensembles and analyzed by the mass spectrometer coupled to the liquid chromatography system. (b) Graphical representation of the infinite Markov model. The initial ensemble is represented by its peptide distribution G0. G0 is assumed to have a Dirichlet process prior with concentration parameter γ and uniform distribution H over the protein database 𝒟 as base probability measure. Local ensembles for which representative peptides have been detected are represented explicitly. Each of these ensembles is indexed by its representative peptide i and characterized by its peptide distribution Gi. Gi is assumed to be sampled from a biased Dirichlet process with G0 as base probability measure. The peptide πt following the series π1,…, πt−1 = i of detected peptides is sampled from Gi. Each peptide πt gives rise to an observable fragment ion spectrum st, defining the peptide-spectrum match (st, πt). The error model for peptide-spectrum matches is omitted for clarity. See Section 2.5 for details.
Fig. 2.
Fig. 2.
θML estimate on simulated data. Performance is evaluated for different training set sizes, i.e. series of peptide assignments (psm) of length ranging from 1000 to 15 000. Performance is reported as log odds of predicted and true parameter value. Results are shown for parameters α, β, γ, respectively, governing the events of self-transitions (a), new transitions (b) and globally new discoveries (c). It can be seen that the parameters can be confidently estimated considering a training series of 10000 peptide assignments.
Fig. 3.
Fig. 3.
Prediction of proteome coverage progression for a dataset comprising 37 LC-MS/MS experiments each giving rise to a series of peptide assignments (psm). We generated 120 training series of varying size (train psm) by subsampling complete LC-MS/MS experiments. We predicted the progression of proteome coverage (peptide discoveries) for each training series and compared to the progression observed for the series of the complete dataset. (a) Prediction accuracy for the 120 training series. Prediction accuracy is given as root mean square deviation (rmsd) from the observed progression of peptide discoveries. (b) Concatenated training and respective predicted progressions (black) from the largest three training series [corresponding items in (a) are encircled] compared to observed progression (red). Vertical lines denote the size of the training series. Vertical lines overlap due to similar sizes around 20 000. (c) Comparison of DiriSim with linear extrapolation of proteome coverage progression of last LC-MS/MS experiment in training series (linear) or respectively extrapolation of logarithmic regression of training series (log). Box plot of log odds of rmsd [log(rmsdDiriSim/rmsdcompare)] for DiriSim and compared method (linear, log) on the 120 training series. Median log odds for comparison with the extrapolation methods linear and log are lower than 0, indicating weaker performance than DiriSim.
Fig. 4.
Fig. 4.
The 5-fold extrapolation beyond the range of the test dataset. (a) Observed progression of the test dataset in red, predicted progression with standard deviations of all (black) and only true positive (green) peptide discoveries. The progression of true positive discoveries stagnates considerably. (b) Relates the absolute number of true positive (tp) peptide discoveries to the fraction of false positive discoveries (fdr peptide discoveries). The fraction of false positive peptide discoveries grows steadily with the total amount of peptide discoveries. Quality requirements on the final set of peptide discoveries limit the maximally achievable proteome coverage as well as the sensible number of LC-MS/MS experiments.

References

    1. Antoniak CE. Mixtures of Dirichlet processes with applications to Bayesian nonparametric problems. Ann. Stat. 1974;2:1152–1174.
    1. Beal MJ, et al. Advances in Neural Information Processing Systems. Vol. 14. MIT Press; 2002. The infinite hidden Markov model.
    1. Blackwell D, MacQueen JB. Ferguson distributions via polya urn schemes. Ann. Stat. 1973;1:353–355.
    1. Brunner E, et al. A high-quality catalog of the Drosophila melanogaster proteome. Nat. Biotechnol. 2007;25:576–583. - PubMed
    1. Domon B, Aebersold R. Mass spectrometry and protein analysis. Science. 2006;312:212–217. - PubMed

Publication types