

A multivariate regression approach to association analysis of a quantitative trait network
- PMID: 19477989
- PMCID: PMC2687972
- DOI: 10.1093/bioinformatics/btp218
A multivariate regression approach to association analysis of a quantitative trait network
Abstract
Motivation: Many complex disease syndromes such as asthma consist of a large number of highly related, rather than independent, clinical phenotypes, raising a new technical challenge in identifying genetic variations associated simultaneously with correlated traits. Although a causal genetic variation may influence a group of highly correlated traits jointly, most of the previous association analyses considered each phenotype separately, or combined results from a set of single-phenotype analyses.
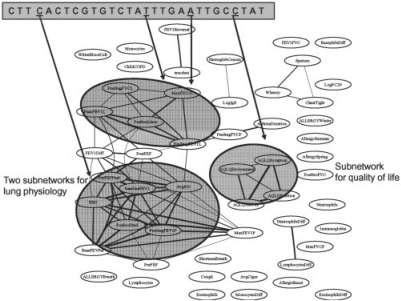
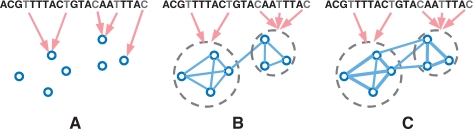
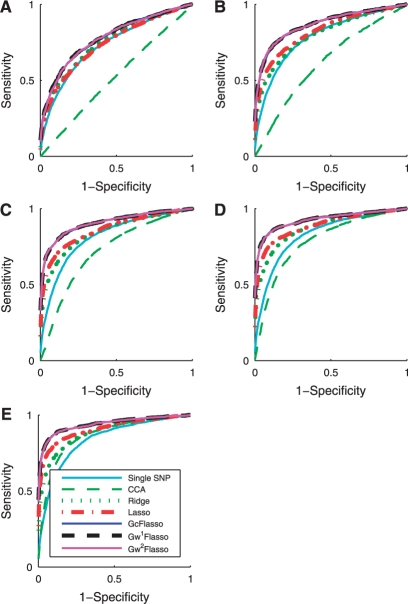
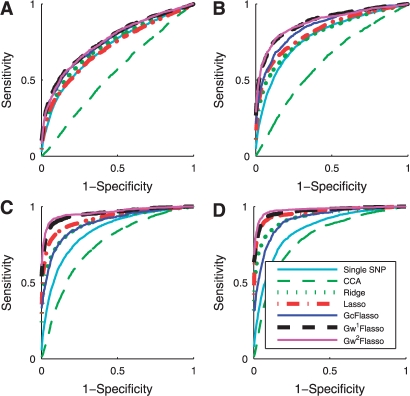
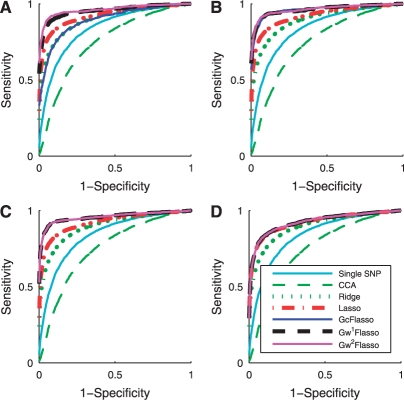
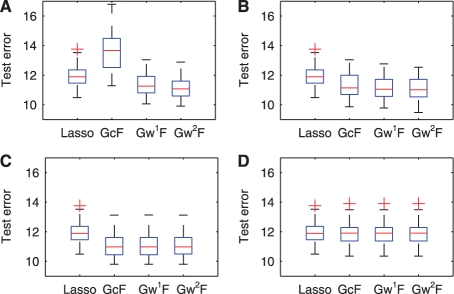
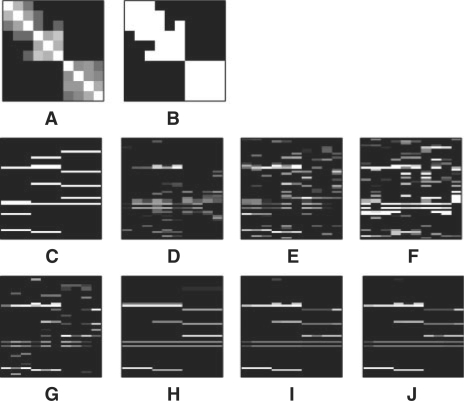
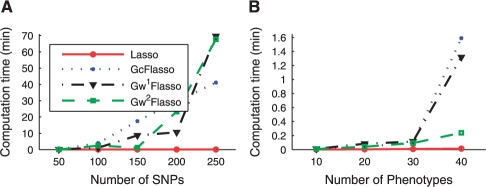
Results: We propose a new statistical framework called graph-guided fused lasso to address this issue in a principled way. Our approach represents the dependency structure among the quantitative traits explicitly as a network, and leverages this trait network to encode structured regularizations in a multivariate regression model over the genotypes and traits, so that the genetic markers that jointly influence subgroups of highly correlated traits can be detected with high sensitivity and specificity. While most of the traditional methods examined each phenotype independently, our approach analyzes all of the traits jointly in a single statistical method to discover the genetic markers that perturb a subset of correlated traits jointly rather than a single trait. Using simulated datasets based on the HapMap consortium data and an asthma dataset, we compare the performance of our method with the single-marker analysis, and other sparse regression methods that do not use any structural information in the traits. Our results show that there is a significant advantage in detecting the true causal single nucleotide polymorphisms when we incorporate the correlation pattern in traits using our proposed methods.
Availability: Software for GFlasso is available at http://www.sailing.cs.cmu.edu/gflasso.html.
Figures
Similar articles
-
Statistical estimation of correlated genome associations to a quantitative trait network.PLoS Genet. 2009 Aug;5(8):e1000587. doi: 10.1371/journal.pgen.1000587. Epub 2009 Aug 14. PLoS Genet. 2009. PMID: 19680538 Free PMC article.
-
Leveraging input and output structures for joint mapping of epistatic and marginal eQTLs.Bioinformatics. 2012 Jun 15;28(12):i137-46. doi: 10.1093/bioinformatics/bts227. Bioinformatics. 2012. PMID: 22689753 Free PMC article.
-
Structured association analysis leads to insight into Saccharomyces cerevisiae gene regulation by finding multiple contributing eQTL hotspots associated with functional gene modules.BMC Genomics. 2013 Mar 21;14:196. doi: 10.1186/1471-2164-14-196. BMC Genomics. 2013. PMID: 23514438 Free PMC article.
-
Genetics of complex traits: prediction of phenotype, identification of causal polymorphisms and genetic architecture.Proc Biol Sci. 2016 Jul 27;283(1835):20160569. doi: 10.1098/rspb.2016.0569. Proc Biol Sci. 2016. PMID: 27440663 Free PMC article. Review.
-
Understanding our drugs and our diseases.Proc Am Thorac Soc. 2006 Jul;3(5):409-12. doi: 10.1513/pats.200601-014AW. Proc Am Thorac Soc. 2006. PMID: 16799083 Free PMC article. Review.
Cited by
-
Consistent Group Identification and Variable Selection in Regression with Correlated Predictors.J Comput Graph Stat. 2013 Apr 1;22(2):319-340. doi: 10.1080/15533174.2012.707849. J Comput Graph Stat. 2013. PMID: 23772171 Free PMC article.
-
Genome-wide detection of intervals of genetic heterogeneity associated with complex traits.Bioinformatics. 2015 Jun 15;31(12):i240-9. doi: 10.1093/bioinformatics/btv263. Bioinformatics. 2015. PMID: 26072488 Free PMC article.
-
Robust network-based analysis of the associations between (epi)genetic measurements.J Multivar Anal. 2018 Nov;168:119-130. doi: 10.1016/j.jmva.2018.06.009. Epub 2018 Jul 10. J Multivar Anal. 2018. PMID: 30983643 Free PMC article.
-
Environmental risk score as a new tool to examine multi-pollutants in epidemiologic research: an example from the NHANES study using serum lipid levels.PLoS One. 2014 Jun 5;9(6):e98632. doi: 10.1371/journal.pone.0098632. eCollection 2014. PLoS One. 2014. PMID: 24901996 Free PMC article.
-
A multivariate genome-wide association analysis of 10 LDL subfractions, and their response to statin treatment, in 1868 Caucasians.PLoS One. 2015 Apr 21;10(4):e0120758. doi: 10.1371/journal.pone.0120758. eCollection 2015. PLoS One. 2015. PMID: 25898129 Free PMC article.
References
-
- Carter S, et al. Gene co-expression network topology provides a framework for molecular characterization of cellular state. Bioinformatics. 2004;20:2242–2250. - PubMed
-
- Efron B, et al. Least angle regression. Ann. Stat. 2004;32:407–499.
Publication types
MeSH terms
LinkOut - more resources
Full Text Sources
Other Literature Sources
