. 2009 Jun 15;25(12):i374-82.
doi: 10.1093/bioinformatics/btp210.

Predicting and understanding the stability of G-quadruplexes

Affiliations

Predicting and understanding the stability of G-quadruplexes

Oliver Stegle et al. Bioinformatics. .

Abstract

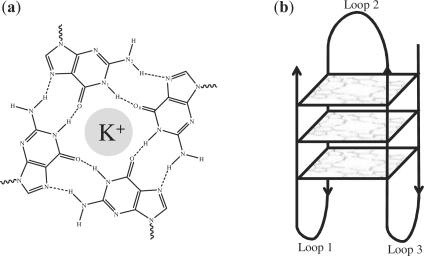
Motivation: G-quadruplexes are stable four-stranded guanine-rich structures that can form in DNA and RNA. They are an important component of human telomeres and play a role in the regulation of transcription and translation. The biological significance of a G-quadruplex is crucially linked with its thermodynamic stability. Hence the prediction of G-quadruplex stability is of vital interest.

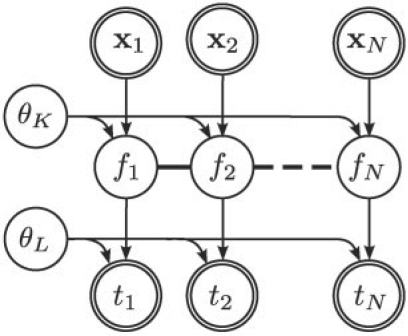
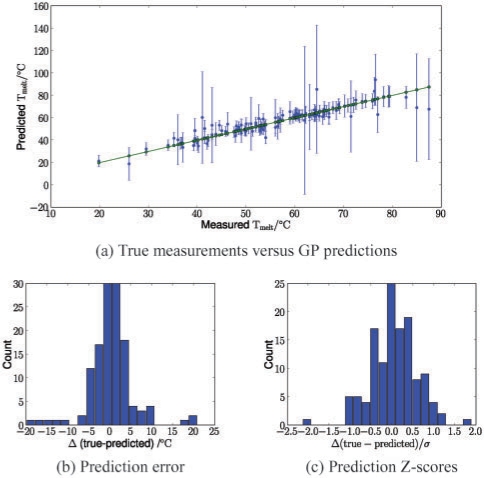
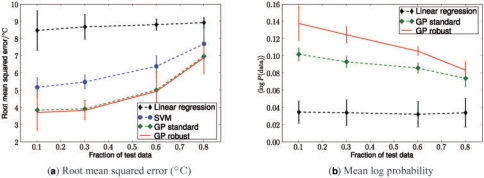
Results: In this article, we present a novel Bayesian prediction framework based on Gaussian process regression to determine the thermodynamic stability of previously unmeasured G-quadruplexes from the sequence information alone. We benchmark our approach on a large G-quadruplex dataset and compare our method to alternative approaches. Furthermore, we propose an active learning procedure which can be used to iteratively acquire data in an optimal fashion. Lastly, we demonstrate the usefulness of our procedure on a genome-wide study of quadruplexes in the human genome.

Availability: A data table with the training sequences is available as supplementary material. Source code is available online at http://www.inference.phy.cam.ac.uk/os252/projects/quadruplexes.

Supplementary information: Supplementary data are available at Bioinformatics online.


Figures

Fig. 1.
Fig. 1.
(a) Hydrogen bond pattern in a G-tetrad. A monovalent cation occupies the central position. (b) Schematic diagram of an intramolecular G-quadruplex, with three G-stacks.
Fig. 2.
Fig. 2.
Bayesian network representation of a GP regression model. The model relates observed independent input/output pairs {xn, tn}n=1N. The thick lines couple the latent function value {fn}, illustrating the smoothness assumptions introduced by the GP prior. The parameters θK and θL denote hyperparameters of the kernel and likelihood, respectively.
Fig. 3.
Fig. 3.
Accuracy of GP predictions for a representative 50:50 training/test split (260 total measurements). (a) True measured melting temperatures (green) and marginal GP predictions with ±2 SDs error bars (blue). (b) Prediction errors Δ. (c) Z-Scores for the predicted values, formula image.
Fig. 4.
Fig. 4.
Comparative predictive performance of different algorithms evaluated as a function of the relative test-set size (260 total measurements). (a) Root mean squared error on the test set. (b) Mean log probability of the test data under the predictive distribution. Error bars show 1SD estimated from 100 random training/test splits.
Fig. 5.
Fig. 5.
Optimized inverse lengthscale hyperparameters. The plot shows empirically estimated means and ±1 SD error bars estimated from 100 restarts of the optimization procedure. Larger bars indicate more important parameters.
Fig. 6.
Fig. 6.
Correlations between inferred hyperparameters illustrated as Hinton diagram. Correlation coefficients were estimated from 500 Monte Carlo sample. The size of the squares denote the strength of the correlation, where white squares indicate positive correlation and black squares negative correlation.
Fig. 7.
Fig. 7.
Average predictive uncertainty for promoter G-quadruplexes as a function of the number of additional measurements. Compared are two random measurement sequences (black) and the active learning strategy (red). The red and black cross indicate the average predictive uncertainty after physically measuring 10 actively (red) or randomly (black) chosen G-quadruplexes.
Fig. 8.
Fig. 8.
Predictive uncertainty for genome-wide G-quadruplex candidates shown in standard deviations in degree celsius.
Fig. 9.
Fig. 9.
Mean predictions of the melting temperature in 100 mM KCl for genome-wide G-quadruplex candidates with a predicted uncertainty <5 C. (a) Histograms for promoter and non-promoter quadruplexes. (b) Cumulative distribution functions.

References

    1. Bishop CM. Pattern Recognition and Machine Learning. New York: Springer; 2006.
    1. Bourdoncle A, et al. Quadruplex-based molecular beacons as tunable DNA probes. J. Am. Chem. Soc. 2006;128:11094–11105. - PubMed
    1. Bugaut A, Balasubramanian S. A sequence-independent study of the influence of short loop lengths on the stability and topology of intramolecular DNA G-quadruplexes. Biochemistry. 2008;47:689. - PMC - PubMed
    1. Burge S, et al. Quadruplex DNA: sequence, topology and structure. Nucleic Acids Res. 2006;34:5402. - PMC - PubMed
    1. Chu W, et al. Biomarker discovery in microarray gene expression data with Gaussian processes. Bioinformatics. 2005;21:3385–3393. - PubMed