

GRK5 deficiency leads to reduced hippocampal acetylcholine level via impaired presynaptic M2/M4 autoreceptor desensitization
- PMID: 19478075
- PMCID: PMC2740582
- DOI: 10.1074/jbc.M109.005959
GRK5 deficiency leads to reduced hippocampal acetylcholine level via impaired presynaptic M2/M4 autoreceptor desensitization
Abstract
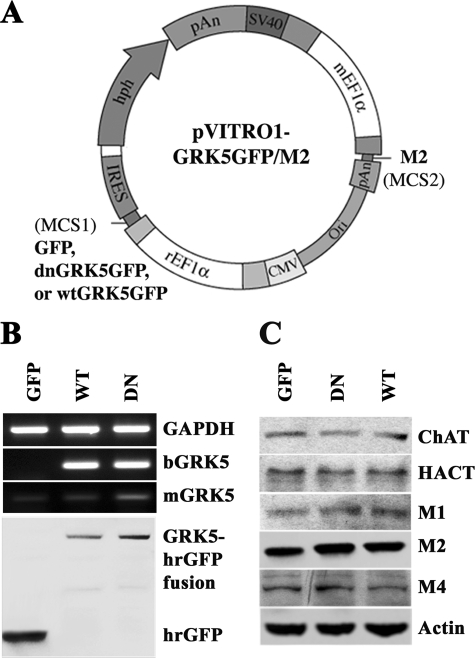
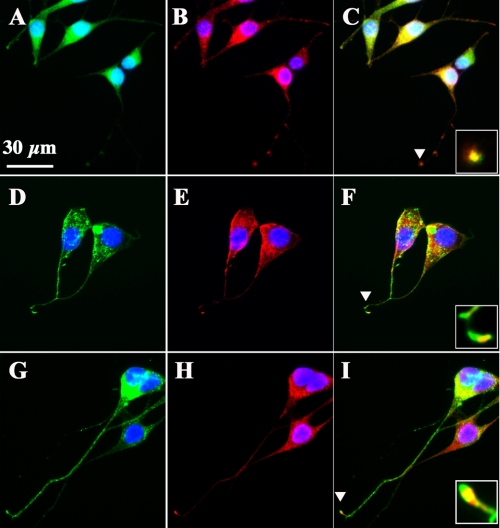
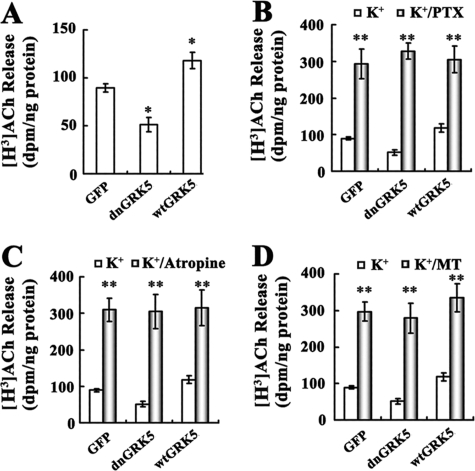
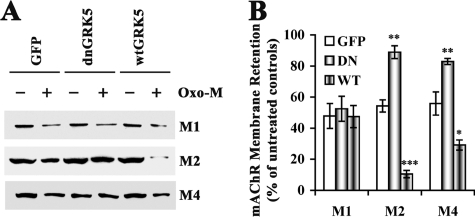
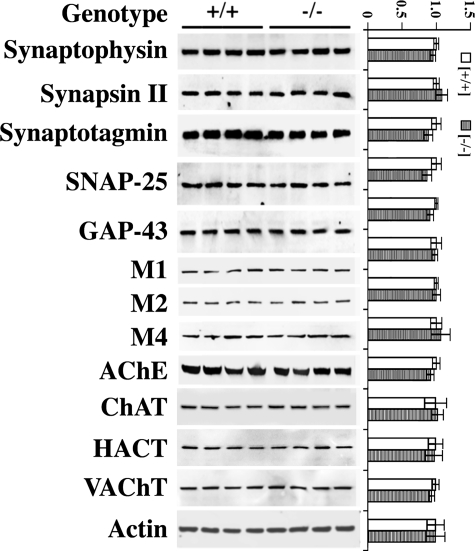
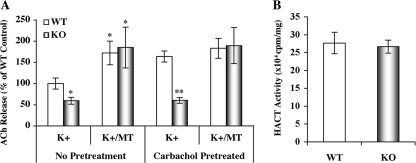
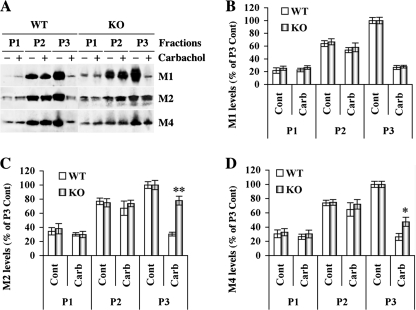
G protein-coupled receptor kinase 5 (GRK5) deficiency has been linked recently to early Alzheimer disease (AD), but the mechanism by which GRK5 deficiency may contribute to AD pathogenesis remains elusive. Here we report that overexpression of dominant negative mutant of GRK5 (dnGRK5) in a cholinergic neuronal cell line led to decreased acetylcholine (ACh) release. This reduction was fully corrected by pertussis toxin, atropine (a nonselective muscarinic antagonist), or methoctramine (a selective M2/M4 muscarinic receptor antagonist). Consistent with results in cultured cells, high potassium-evoked ACh release in hippocampal slices from young GRK5 knock-out mice was significantly reduced compared with wild type littermates, and this reduced ACh release was also fully corrected by methoctramine. In addition, following treatment with the nonselective muscarinic agonist oxotremorine-M, M2, and M4 receptors underwent significantly reduced internalization in GRK5KO slices compared with wild type slices, as assessed by plasma membrane retention of receptor immunoreactivity, whereas M1 receptor internalization was not affected by loss of GRK5 expression. Moreover, Western blotting revealed no synaptic or cholinergic degenerative changes in young GRK5 knock-out mice. Altogether, these results suggest that GRK5 deficiency leads to a reduced hippocampal ACh release and cholinergic hypofunction by selective impairment of desensitization of presynaptic M2/M4 autoreceptors. Because this nonstructural cholinergic hypofunction precedes the hippocampal cholinergic hypofunction associated with structural cholinergic degeneration and cognitive decline in aged GRK5 knock-out mice, this nonstructural alteration may be an early event contributing to cholinergic degeneration in AD.
Figures
Similar articles
-
GRK5 deficiency accelerates {beta}-amyloid accumulation in Tg2576 mice via impaired cholinergic activity.J Biol Chem. 2010 Dec 31;285(53):41541-8. doi: 10.1074/jbc.M110.170894. Epub 2010 Nov 1. J Biol Chem. 2010. PMID: 21041302 Free PMC article.
-
Characterization of central inhibitory muscarinic autoreceptors by the use of muscarinic acetylcholine receptor knock-out mice.J Neurosci. 2002 Mar 1;22(5):1709-17. doi: 10.1523/JNEUROSCI.22-05-01709.2002. J Neurosci. 2002. PMID: 11880500 Free PMC article.
-
GRK5 dysfunction accelerates tau hyperphosphorylation in APP (swe) mice through impaired cholinergic activity.Neuroreport. 2014 May 7;25(7):542-7. doi: 10.1097/WNR.0000000000000142. Neuroreport. 2014. PMID: 24598771
-
N-Ethylmaleimide differentiates between the M2- and M4-autoreceptor-mediated inhibition of acetylcholine release in the mouse brain.Naunyn Schmiedebergs Arch Pharmacol. 2018 Nov;391(11):1295-1299. doi: 10.1007/s00210-018-1539-8. Epub 2018 Jul 21. Naunyn Schmiedebergs Arch Pharmacol. 2018. PMID: 30032313
-
Cholinergic muscarinic M1 and M4 receptors as therapeutic targets for cognitive, behavioural, and psychological symptoms in psychiatric and neurological disorders.Drug Discov Today. 2019 Dec;24(12):2307-2314. doi: 10.1016/j.drudis.2019.08.009. Epub 2019 Sep 6. Drug Discov Today. 2019. PMID: 31499186 Review.
Cited by
-
Basic fibroblast growth factor protects C17.2 cells from radiation-induced injury through ERK1/2.CNS Neurosci Ther. 2012 Sep;18(9):767-72. doi: 10.1111/j.1755-5949.2012.00365.x. CNS Neurosci Ther. 2012. PMID: 22943143 Free PMC article.
-
Dangerous Liaisons: Tau Interaction with Muscarinic Receptors.Curr Alzheimer Res. 2020;17(3):224-237. doi: 10.2174/1567205017666200424134311. Curr Alzheimer Res. 2020. PMID: 32329686 Free PMC article. Review.
-
G-protein-coupled receptor kinases in inflammation and disease.Genes Immun. 2015 Sep;16(6):367-77. doi: 10.1038/gene.2015.26. Epub 2015 Jul 30. Genes Immun. 2015. PMID: 26226012 Free PMC article. Review.
-
The GRKs Reactome: Role in Cell Biology and Pathology.Int J Mol Sci. 2021 Mar 25;22(7):3375. doi: 10.3390/ijms22073375. Int J Mol Sci. 2021. PMID: 33806057 Free PMC article. Review.
-
GRK5 deficiency accelerates {beta}-amyloid accumulation in Tg2576 mice via impaired cholinergic activity.J Biol Chem. 2010 Dec 31;285(53):41541-8. doi: 10.1074/jbc.M110.170894. Epub 2010 Nov 1. J Biol Chem. 2010. PMID: 21041302 Free PMC article.
References
-
- Kohout T. A., Lefkowitz R. J. (2003) Mol. Pharmacol. 63, 9–18 - PubMed
-
- Pitcher J. A., Freedman N. J., Lefkowitz R. J. (1998) Annu. Rev. Biochem. 67, 653–692 - PubMed
-
- Suo Z., Wu M., Citron B. A., Wong G. T., Festoff B. W. (2005) Neurobiol. Aging 25, S2–291
-
- Suo Z., Cox A. A., Bartelli N., Rasul I., Festoff B. W., Premont R. T., Arendash G. W. (2007) Neurobiol. Aging 28, 1873–1888 - PubMed
Publication types
MeSH terms
Substances
LinkOut - more resources
Full Text Sources
Other Literature Sources
Molecular Biology Databases
