Comparison of GFL-GFRalpha complexes: further evidence relating GFL bend angle to RET signalling
- PMID: 19478429
- PMCID: PMC2688408
- DOI: 10.1107/S1744309109017722
Comparison of GFL-GFRalpha complexes: further evidence relating GFL bend angle to RET signalling
Abstract
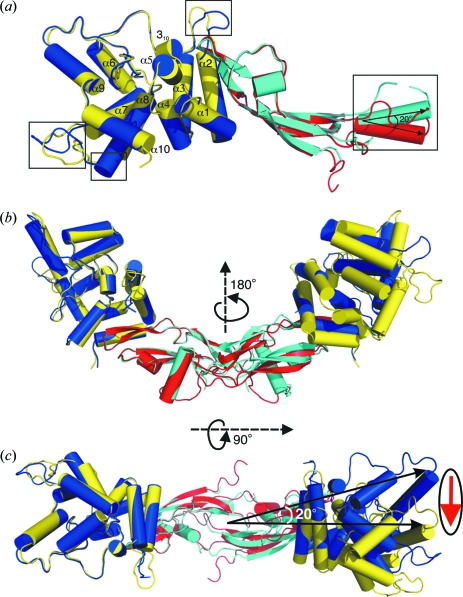
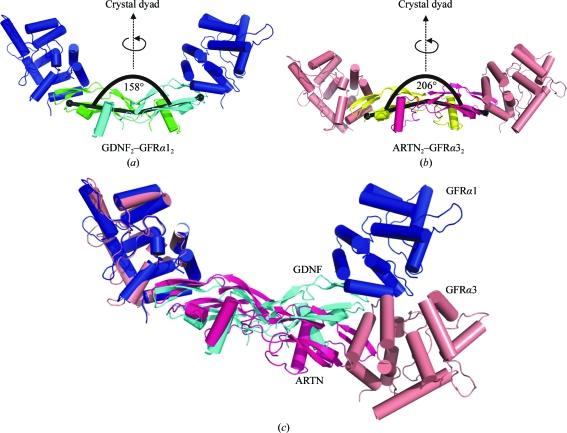
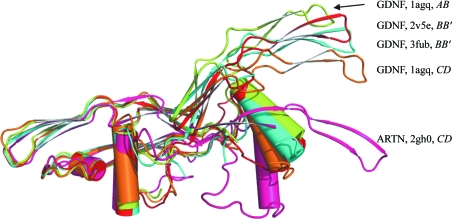
Glial cell line-derived neurotrophic factor (GDNF) activates the receptor tyrosine kinase RET by binding to the GDNF-family receptor alpha1 (GFRalpha1) and forming the GDNF(2)-GFRalpha1(2)-RET(2) heterohexamer complex. A previous crystal structure of the GDNF(2)-GFRalpha1(2) complex (PDB code 2v5e) suggested that differences in signalling in GDNF-family ligand (GFL) complexes might arise from differences in the bend angle between the two monomers in the GFL homodimer. Here, a 2.35 A resolution structure of the GDNF(2)-GFRalpha1(2) complex crystallized with new cell dimensions is reported. The structure was refined to a final R factor of 22.5% (R(free) = 28%). The structures of both biological tetrameric complexes in the asymmetric unit are very similar to 2v5e and different from the artemin-GFRalpha3 structure, even though there is a small change in the structure of the GDNF. By comparison of all known GDNF and artemin structures, it is concluded that GDNF is more bent and more flexible than artemin and that this may be related to RET signalling. Comparisons also suggest that the differences between artemin and GDNF arise from the increased curvature of the artemin ;fingers', which both increases the buried surface area in the monomer-monomer interface and changes the intermonomer bend angle. From sequence comparison, it is suggested that neuturin (the second GFL) adopts an artemin-like conformation, while persephin has a different conformation to the other three.
Figures
Similar articles
-
Functional mapping of receptor specificity domains of glial cell line-derived neurotrophic factor (GDNF) family ligands and production of GFRalpha1 RET-specific agonists.J Biol Chem. 2000 Feb 4;275(5):3412-20. doi: 10.1074/jbc.275.5.3412. J Biol Chem. 2000. PMID: 10652334
-
The structure of the glial cell line-derived neurotrophic factor-coreceptor complex: insights into RET signaling and heparin binding.J Biol Chem. 2008 Dec 12;283(50):35164-72. doi: 10.1074/jbc.M802543200. Epub 2008 Oct 8. J Biol Chem. 2008. PMID: 18845535 Free PMC article.
-
Artemin, a novel member of the GDNF ligand family, supports peripheral and central neurons and signals through the GFRalpha3-RET receptor complex.Neuron. 1998 Dec;21(6):1291-302. doi: 10.1016/s0896-6273(00)80649-2. Neuron. 1998. PMID: 9883723
-
Structural studies of GDNF family ligands with their receptors-Insights into ligand recognition and activation of receptor tyrosine kinase RET.Biochim Biophys Acta. 2013 Oct;1834(10):2205-12. doi: 10.1016/j.bbapap.2012.10.008. Epub 2012 Oct 17. Biochim Biophys Acta. 2013. PMID: 23085183 Review.
-
Novel functions and signalling pathways for GDNF.J Cell Sci. 2003 Oct 1;116(Pt 19):3855-62. doi: 10.1242/jcs.00786. J Cell Sci. 2003. PMID: 12953054 Review.
Cited by
-
A two-site flexible clamp mechanism for RET-GDNF-GFRα1 assembly reveals both conformational adaptation and strict geometric spacing.Structure. 2021 Jul 1;29(7):694-708.e7. doi: 10.1016/j.str.2020.12.012. Epub 2021 Jan 22. Structure. 2021. PMID: 33484636 Free PMC article.
-
Structural basis for catalyzed assembly of the Sonic hedgehog-Patched1 signaling complex.Dev Cell. 2022 Mar 14;57(5):670-685.e8. doi: 10.1016/j.devcel.2022.02.008. Epub 2022 Feb 28. Dev Cell. 2022. PMID: 35231446 Free PMC article.
-
Neurturin overexpression in dopaminergic neurons induces presynaptic and postsynaptic structural changes in rats with chronic 6-hydroxydopamine lesion.PLoS One. 2017 Nov 27;12(11):e0188239. doi: 10.1371/journal.pone.0188239. eCollection 2017. PLoS One. 2017. PMID: 29176874 Free PMC article.
-
Novel Insights into the Pathogenesis of Monogenic Congenital Anomalies of the Kidney and Urinary Tract.J Am Soc Nephrol. 2018 Jan;29(1):36-50. doi: 10.1681/ASN.2017050561. Epub 2017 Oct 27. J Am Soc Nephrol. 2018. PMID: 29079659 Free PMC article. Review.
-
GFRAL is the receptor for GDF15 and the ligand promotes weight loss in mice and nonhuman primates.Nat Med. 2017 Oct;23(10):1150-1157. doi: 10.1038/nm.4392. Epub 2017 Aug 28. Nat Med. 2017. PMID: 28846097
References
-
- Airaksinen, M. S. & Saarma, M. (2002). Nature Rev. Neurosci.3, 383–394. - PubMed
-
- Airaksinen, M. S., Titievsky, A. & Saarma, M. (1999). Mol. Cell. Neurosci.13, 313–325. - PubMed
-
- Baloh, R. H., Tansey, M. G., Johnson, E. M. Jr & Milbrandt, J. (2000). J. Biol. Chem.275, 3412–3420. - PubMed
-
- Baloh, R. H., Tansey, M. G., Lampe, P. A., Fahrner, T. J., Enomoto, H., Simburger, K. S., Leitner, M. L., Araki, T., Johnson, E. M. Jr & Milbrandt, J. (1998). Neuron, 21, 1291–1302. - PubMed
-
- Collaborative Computational Project, Number 4 (1994). Acta Cryst. D50, 760–763. - PubMed
Publication types
MeSH terms
Substances
LinkOut - more resources
Full Text Sources
Other Literature Sources
Molecular Biology Databases