Structural adaptation and heterogeneity of normal and tumor microvascular networks
- PMID: 19478883
- PMCID: PMC2682204
- DOI: 10.1371/journal.pcbi.1000394
Structural adaptation and heterogeneity of normal and tumor microvascular networks
Abstract
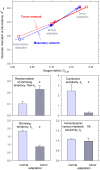
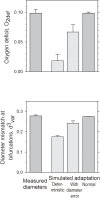
Relative to normal tissues, tumor microcirculation exhibits high structural and functional heterogeneity leading to hypoxic regions and impairing treatment efficacy. Here, computational simulations of blood vessel structural adaptation are used to explore the hypothesis that abnormal adaptive responses to local hemodynamic and metabolic stimuli contribute to aberrant morphological and hemodynamic characteristics of tumor microcirculation. Topology, vascular diameter, length, and red blood cell velocity of normal mesenteric and tumor vascular networks were recorded by intravital microscopy. Computational models were used to estimate hemodynamics and oxygen distribution and to simulate vascular diameter adaptation in response to hemodynamic, metabolic and conducted stimuli. The assumed sensitivity to hemodynamic and conducted signals, the vascular growth tendency, and the random variability of vascular responses were altered to simulate 'normal' and 'tumor' adaptation modes. The heterogeneous properties of vascular networks were characterized by diameter mismatch at vascular branch points (d(3) (var)) and deficit of oxygen delivery relative to demand (O(2def)). In the tumor, d(3) (var) and O(2def) were higher (0.404 and 0.182) than in normal networks (0.278 and 0.099). Simulated remodeling of the tumor network with 'normal' parameters gave low values (0.288 and 0.099). Conversely, normal networks attained tumor-like characteristics (0.41 and 0.179) upon adaptation with 'tumor' parameters, including low conducted sensitivity, increased growth tendency, and elevated random biological variability. It is concluded that the deviant properties of tumor microcirculation may result largely from defective structural adaptation, including strongly reduced responses to conducted stimuli.
Conflict of interest statement
The authors have declared that no competing interests exist.
Figures


Similar articles
-
Structural adaptation of microvessel diameters in response to metabolic stimuli: where are the oxygen sensors?Am J Physiol Heart Circ Physiol. 2009 Dec;297(6):H2206-19. doi: 10.1152/ajpheart.00348.2009. Epub 2009 Sep 25. Am J Physiol Heart Circ Physiol. 2009. PMID: 19783778 Free PMC article.
-
Structural adaptation of microvascular networks: functional roles of adaptive responses.Am J Physiol Heart Circ Physiol. 2001 Sep;281(3):H1015-25. doi: 10.1152/ajpheart.2001.281.3.H1015. Am J Physiol Heart Circ Physiol. 2001. PMID: 11514266
-
Remodeling of blood vessels: responses of diameter and wall thickness to hemodynamic and metabolic stimuli.Hypertension. 2005 Oct;46(4):725-31. doi: 10.1161/01.HYP.0000184428.16429.be. Epub 2005 Sep 19. Hypertension. 2005. PMID: 16172421
-
Structural adaptation of normal and tumour vascular networks.Basic Clin Pharmacol Toxicol. 2012 Jan;110(1):63-9. doi: 10.1111/j.1742-7843.2011.00815.x. Epub 2011 Nov 9. Basic Clin Pharmacol Toxicol. 2012. PMID: 21995550 Free PMC article. Review.
-
Making microvascular networks work: angiogenesis, remodeling, and pruning.Physiology (Bethesda). 2014 Nov;29(6):446-55. doi: 10.1152/physiol.00012.2014. Physiology (Bethesda). 2014. PMID: 25362638 Free PMC article. Review.
Cited by
-
In Silico Approach to Model Heat Distribution of Magnetic Hyperthermia in the Tumoral and Healthy Vascular Network Using Tumor-on-a-Chip to Evaluate Effective Therapy.Pharmaceutics. 2024 Aug 31;16(9):1156. doi: 10.3390/pharmaceutics16091156. Pharmaceutics. 2024. PMID: 39339193 Free PMC article.
-
The influence of tumour vasculature on fluid flow in solid tumours: a mathematical modelling study.Biophys Rep. 2021 Feb 28;7(1):35-54. doi: 10.52601/bpr.2021.200041. Biophys Rep. 2021. PMID: 37288083 Free PMC article.
-
Tissue Factor-Targeted "O2-Evolving" Nanoparticles for Photodynamic Therapy in Malignant Lymphoma.Front Oncol. 2020 Nov 10;10:524712. doi: 10.3389/fonc.2020.524712. eCollection 2020. Front Oncol. 2020. PMID: 33240803 Free PMC article.
-
Pharmacokinetic/pharmacodynamic modeling identifies SN30000 and SN29751 as tirapazamine analogues with improved tissue penetration and hypoxic cell killing in tumors.Clin Cancer Res. 2010 Oct 15;16(20):4946-57. doi: 10.1158/1078-0432.CCR-10-1439. Epub 2010 Aug 20. Clin Cancer Res. 2010. PMID: 20732963 Free PMC article.
-
Optical coherence tomography angiography in the evaluation of vascular patterns of ocular surface squamous neoplasia during topical medical treatment.Ocul Surf. 2022 Jul;25:8-18. doi: 10.1016/j.jtos.2022.03.006. Epub 2022 Mar 29. Ocul Surf. 2022. PMID: 35358712 Free PMC article.
References
-
- Folkman J. Tumor angiogenesis: therapeutic implications. N Engl J Med. 1971;285:1182–1186. - PubMed
-
- Jain RK. Normalizing tumor vasculature with anti-angiogenic therapy: a new paradigm for combination therapy. Nat Med. 2001;7:987–989. - PubMed
-
- Gazit Y, Berk DA, Leunig M, Baxter LT, Jain RK. Scale-invariant behavior and vascular network formation in normal and tumor tissue. Phys Rev Lett. 1995;75:2428–2431. - PubMed
-
- Baish JW, Gazit Y, Berk DA, Nozue M, Baxter LT, Jain RK. Role of tumor vascular architecture in nutrient and drug delivery: an invasion percolation-based network model. Microvasc Res. 1996;51:327–346. - PubMed
-
- Dewhirst MW, Navia IC, Brizel DM, Willett C, Secomb TW. Multiple etiologies of tumor hypoxia require multifaceted solutions. Clin Cancer Res. 2007;13:375–377. - PubMed
Publication types
MeSH terms
Substances
Grants and funding
LinkOut - more resources
Full Text Sources
Other Literature Sources

