. 2009 May 27;4(5):e5529.
doi: 10.1371/journal.pone.0005529.

Intense habitat-specific fisheries-induced selection at the molecular Pan I locus predicts imminent collapse of a major cod fishery

Affiliations

Intense habitat-specific fisheries-induced selection at the molecular Pan I locus predicts imminent collapse of a major cod fishery

Einar Arnason et al. PLoS One. .

Abstract

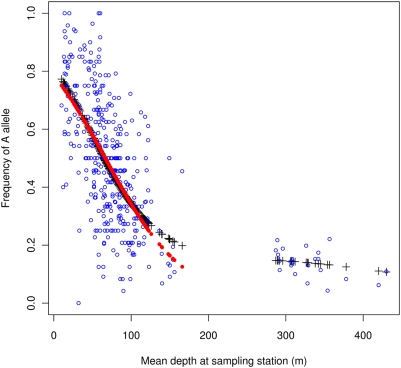
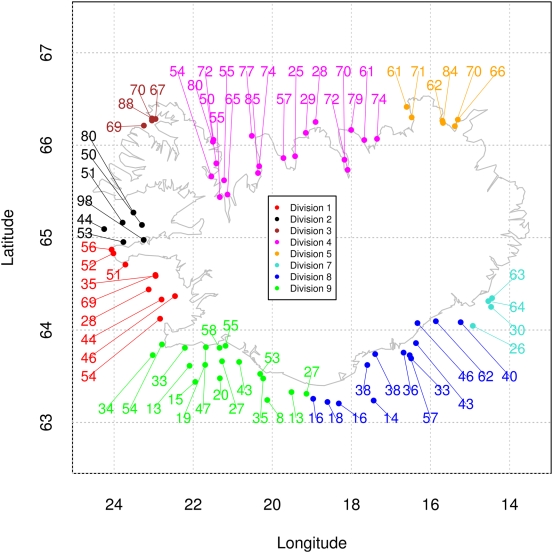
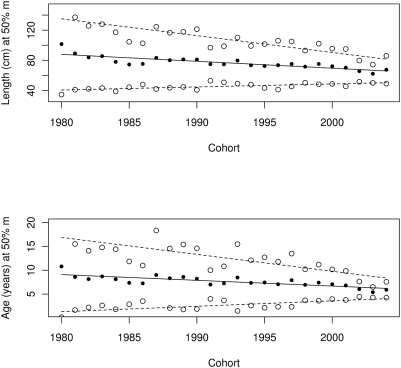
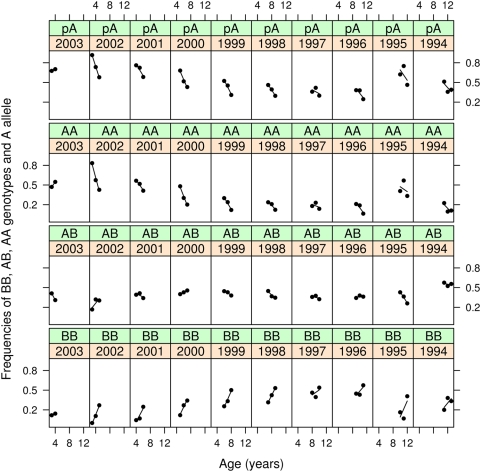
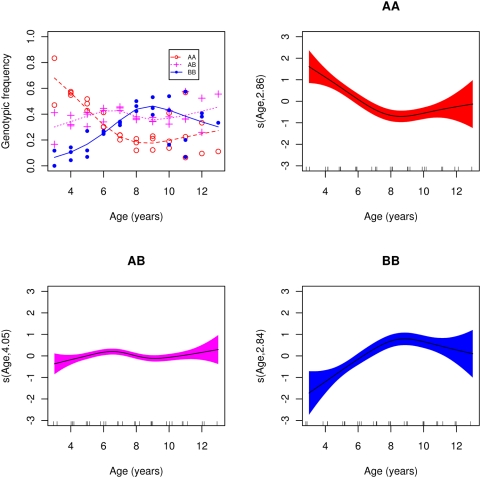
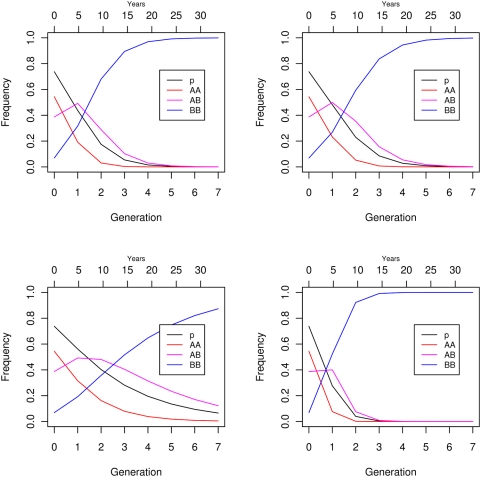
Predation is a powerful agent in the ecology and evolution of predator and prey. Prey may select multiple habitats whereby different genotypes prefer different habitats. If the predator is also habitat-specific the prey may evolve different habitat occupancy. Drastic changes can occur in the relation of the predator to the evolved prey. Fisheries exert powerful predation and can be a potent evolutionary force. Fisheries-induced selection can lead to phenotypic changes that influence the collapse and recovery of the fishery. However, heritability of the phenotypic traits involved and selection intensities are low suggesting that fisheries-induced evolution occurs at moderate rates at decadal time scales. The Pantophysin I (Pan I) locus in Atlantic cod (Gadus morhua), representing an ancient balanced polymorphism predating the split of cod and its sister species, is under an unusual mix of balancing and directional selection including current selective sweeps. Here we show that Pan I alleles are highly correlated with depth with a gradient of 0.44% allele frequency change per meter. AA fish are shallow-water and BB deep-water adapted in accordance with behavioral studies using data storage tags showing habitat selection by Pan I genotype. AB fish are somewhat intermediate although closer to AA. Furthermore, using a sampling design covering space and time we detect intense habitat-specific fisheries-induced selection against the shallow-water adapted fish with an average 8% allele frequency change per year within year class. Genotypic fitness estimates (0.08, 0.27, 1.00 of AA, AB, and BB respectively) predict rapid disappearance of shallow-water adapted fish. Ecological and evolutionary time scales, therefore, are congruent. We hypothesize a potential collapse of the fishery. We find that probabilistic maturation reaction norms for Atlantic cod at Iceland show declining length and age at maturing comparable to changes that preceded the collapse of northern cod at Newfoundland, further supporting the hypothesis. We speculate that immediate establishment of large no-take reserves may help avert collapse.


Conflict of interest statement

Competing Interests: The authors have declared that no competing interests exist.

Figures

Figure 1
Figure 1. Frequency of Pan I A allele on mean depth (m) of sampling.
Points (open circles ○) represent frequency at all sampling stations for Atlantic cod in Icelandic Marine Research Institute spring spawning surveys in 2005, 2006, and 2007. Pluses+represent a generalized additive model (gam) smooth fit. Solid dots • represent a generalized linear regression (glm) of allele frequency on depth for depths less than 200 m; glm linear predictor η = 1.297−0.0195depth yields an allele frequency intercept of 78.5% and 34.2% at 100 m, a 44.3% change.
Figure 2
Figure 2. Frequency (percent) of the Pan I A allele in squares within areas.
Areas defined by one degree longitude and one half degree latitude (dotted lines) are each split into four equal sized squares (not shown). Sampling stations within subareas are pooled for frequency estimation. Atlantic cod in Icelandic Marine Research Institute spring spawning surveys in 2005, 2006, and 2007. Color coded divisions based on revised metacod definitions as detailed in paper , .
Figure 3
Figure 3. Catch (tons), effort and catch per unit effort, CPUE, at year for different gear.
Data are from log book records. Parts of these data are the same as figures 9.3.1. and 9.3.2 in . Units of effort for different gear are described in Methods.
Figure 4
Figure 4. Probabilistic maturation reaction norms: length and age at 50% probability of maturing on cohort.
Solid dots and solid lines represent length or age at 50% probability of maturing. Upper and lower open dots and dashed lines represent length or age at 95 and 5% probability of maturing respectively. Lines are linear regression of length or age on cohort. Based on data on mean length, age and maturity ratio from table 3.1.4 in Anonymous (and see [74]).
Figure 5
Figure 5. Allelic and genotypic frequencies at age conditioned on year class.
Spring spawning Atlantic cod at Iceland. Frequency of A allele, p A (top panel row), and frequencies of AA, AB, and BB genotypes, fAA, fAB, and fBB (panel rows 2–4 respectively). Panels represent year classes arranged most recent to older from left to right in each row. Points • represent observed frequencies; lines represent linear regression of frequency on age.
Figure 6
Figure 6. Genotypic frequencies on age in years within year class.
Frequencies of AA genotype (red open circles ○, dashed line), AB (magenta pluses +, dotted line), and BB (blue filled circles •, solid line). Lines represent a generalized additive model (gam) smooth fit with quasibinomial link (panel A). Panels B, C and D: gam smooth fit of genotypic frequency on age within year class for the AA, AB and BB genotypes respectively; shaded region represents two standard errors above and below fit. Smooth carries estimated degrees of freedom.
Figure 7
Figure 7. Predicted allele and genotypic frequency changes with a constant-fitness viability model of selection.
Top left panel based on fitness estimates from Table 6; top right panel based on fitness estimates from Supplementary Table S2; lower left panel based on highest fitness estimates from Table 6 (a best case scenario); lower right panel based on lowest fitness estimates from Table 6 (a worst case scenario). Starting frequency of 0.738 assumed based on intercept of gam fit in Figure 6. Years based on a generation time of 4.8 years . Color codes are black for the A allele and red, magenta, and blue for the AA, AB, and BB genotypes respectively.

References

    1. Kurlansky M. Cod: A Biography of the Fish That Changed the World. Ottawa, Canada: Alfred A. Knopf; 1997.
    1. Rijnsdorp AD. Fisheries as a large-scale experiment on life-history evolution—disentangling phenotypic and genetic effects in changes in maturation and reproduction of North-Sea plaice, Pleuronectes platessa L. Oecologia. 1993;96:391–401. - PubMed
    1. Hutchings JA. The cod that got away. Nature. 2004;428:899–890. - PubMed
    1. Law R. Fishing, selection, and phenotypic evolution. ICES J Mar Sci. 2000;57:659–668.
    1. Conover DO. Darwinian fishery science. Mar Ecol Prog Ser. 2000;208:303–307.

Publication types