

Review
doi: 10.1007/s12350-009-9100-2.
Epub 2009 May 29.
Applications of optical coherence tomography in cardiovascular medicine, Part 2
Affiliations
- PMID: 19479314
- PMCID: PMC4352576
- DOI: 10.1007/s12350-009-9100-2
Item in Clipboard
Review
Applications of optical coherence tomography in cardiovascular medicine, Part 2
J Nucl Cardiol.
2009 Jul-Aug.
No abstract available
Figures
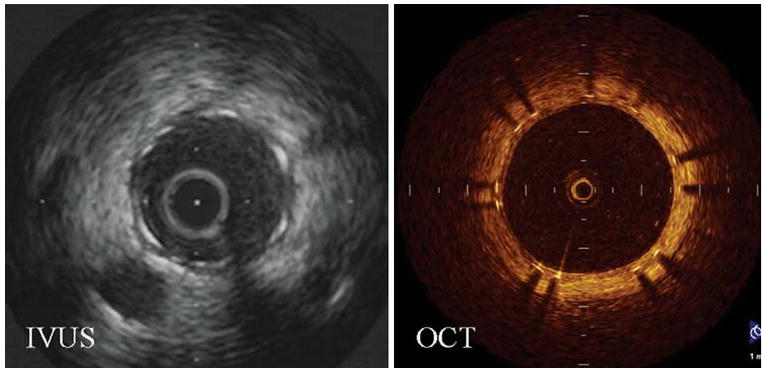
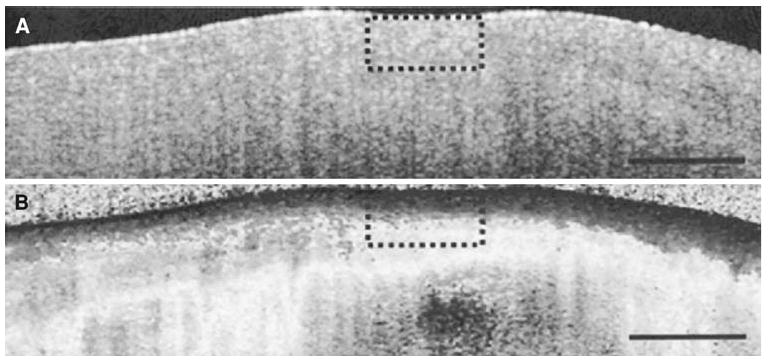
Representative cross-sectional images that demonstrate the superiority of OCT over IVUS in resolving neointima growth at the clinically important 6-month follow-up. Images were obtained at the same distance from a major side branch (Reproduced with permission from14).
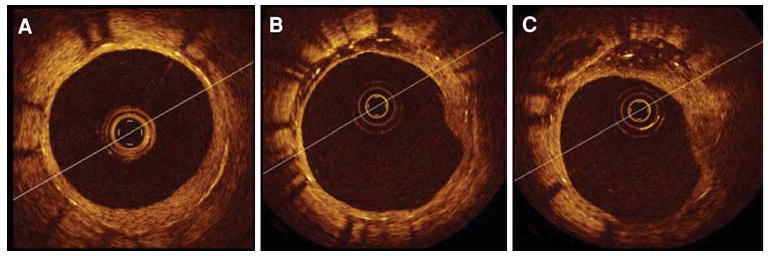
Heterogeneous vessel response in a paclitaxel-eluting stent recorded at 13 months during elective OCT follow up. Significant differences in vessel response were observed in this short segment along the same stent. (A) stent coverage of neointima; (B-C) asymmetrical neointimal coverage with signal attenuation (“black holes”) of the tissue growth from 9 o'clock to 12 o'clock (Reproduced with permission from36).
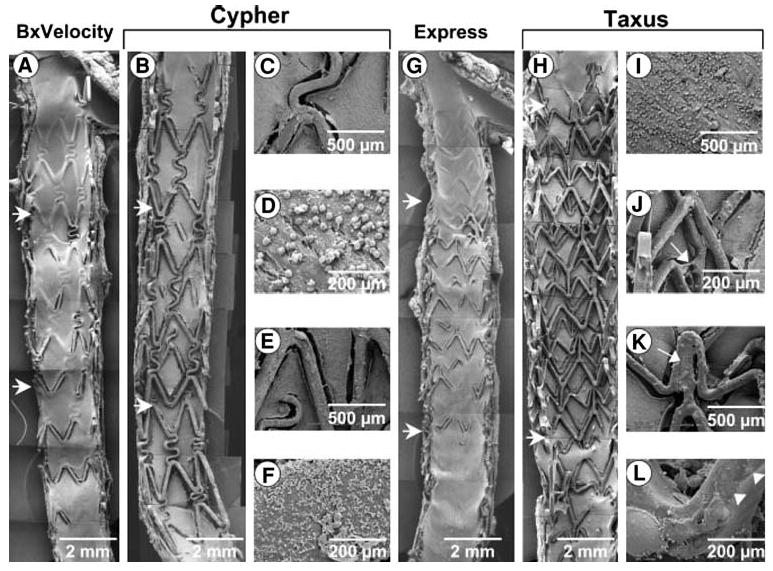
SEM of overlapping 28-day BxVelocity (A), Cypher (B-F), Express (G), and Taxus (H-L) stents. Regions of overlap are within horizontal arrows. There is less surface coverage by endothelial cells on Taxus than Cypher stents, specifically in segments of overlap. Overlapping segments within BxVelocity and Express stents showed far greater endothelialization than DES. Higherpower views of Cypher stents (C-F) from segment of overlap show adherent platelets and inflammatory cells on stent struts and adjoining neointima. Higherpower images from overlapping segments of Taxus stents (I-L) show greater inflammatory infiltrate (I), polymer sticking and stretching across stent struts (J, arrow), unexpanded struts (K, arrow), and irregular distribution of the polymer over stent strut surface (L, arrowheads) (Reproduced with permission from39).
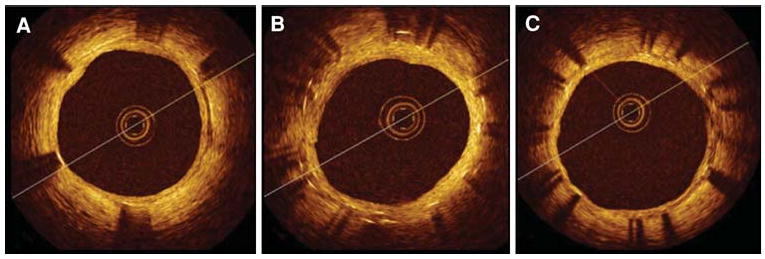
OCT cross-sectional images of multiple CypherTM stents in overlap implanted in a long lesion. Elective follow-up at 6 months after the implant. (A) distal stent; (B) overlapping segment with dual strut layers; (C) proximal stent. Well-apposed stent struts at all cross sections with uniform coverage and minimal neointimal growth. No differences were observed between single and double layer responses.
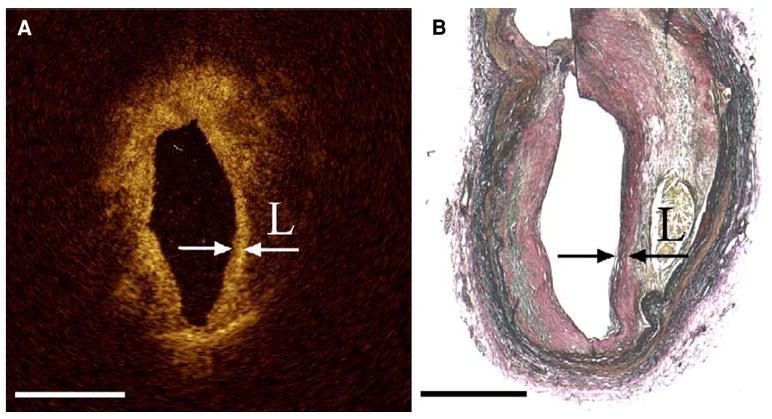
(A) OCT image with arrows indicating the borders of a thin fibrous cap overlying a lipid pool with corresponding histology (B) Note that the “back wall” of the lipid core is poorly visualized with OCT due to light attenuation (Reproduced with permission from47).
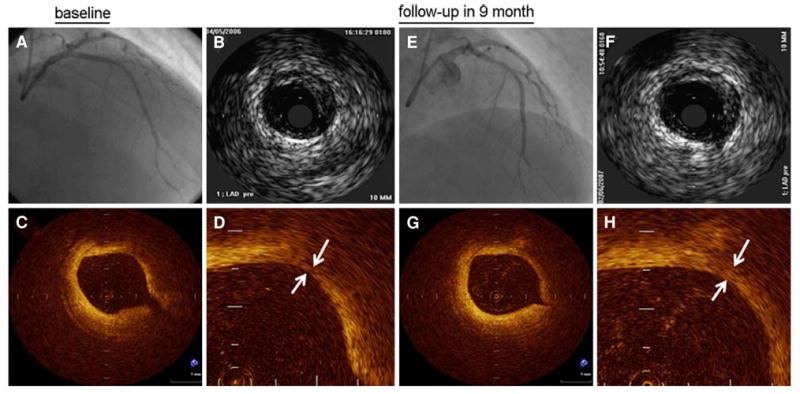
Angiography (A, E) and IVUS (B, F) images from a patient before and after statin therapy with corresponding OCT images in the bottom row. Before statin therapy, the patient's fibrous cap thickness (indicated by white arrows in D) was 110 μm and increased to 320 μm (white arrows in H) at 9-month follow-up.
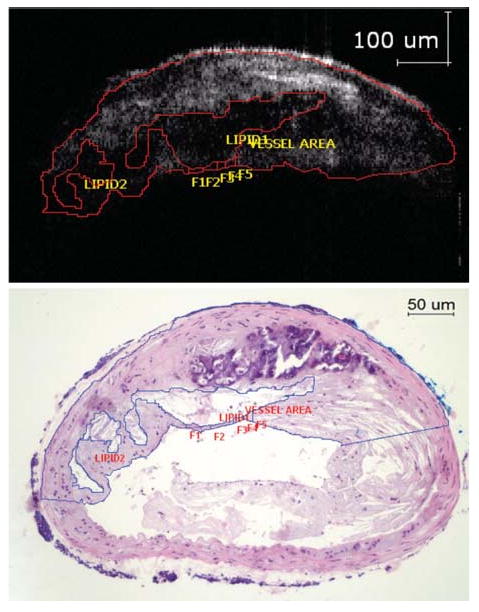
The OCT image (above) shows areas with poor signal corresponding to lipid rich areas as seen from the histology (below). The lipid core size can be accurately measured and expressed as a percentage of the total plaque (21.4% via OCT compared to 19.7% via histology for this study). Note the inability of OCT to visualize the lower arterial wall due to light attenuation (Reproduced with permission from53).
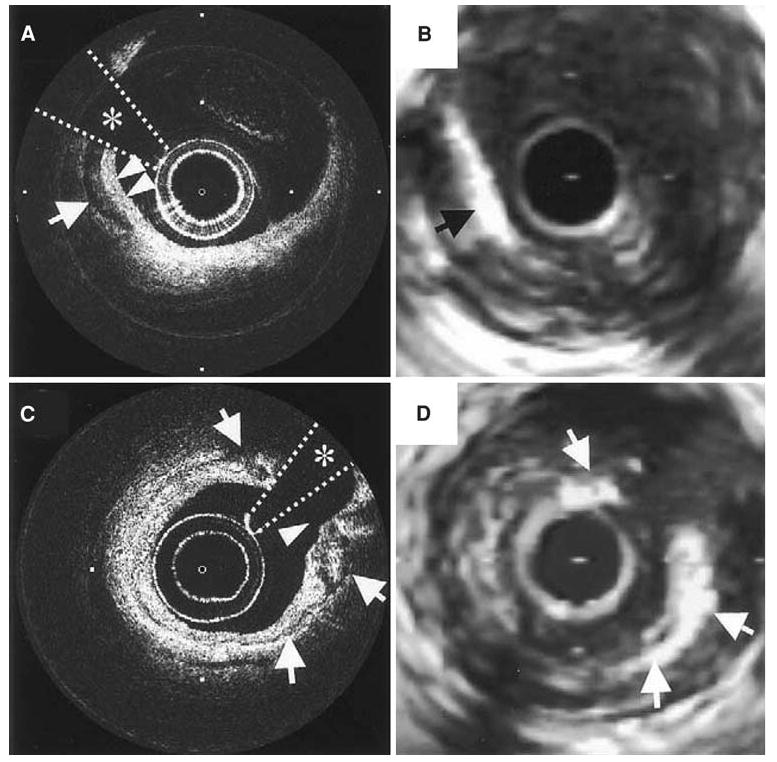
(A, C) OCT images of a coronary plaque with corresponding IVUS (B, D) images. The arrow in A points to a well-delineated and signal-poor area corresponding to a macro-calcification which is also seen in the IVUS image (B). Notice that in A the borders of the overlying fibrous tissue and calcification are “in focus” whereas in the IVUS image, the bright echo from the calcification obscures the features of the fibrous tissue. In image C, the arrows denote a thin layer of circumferential calcification with the surrounding features well defined unlike in the corresponding IVUS image (D).
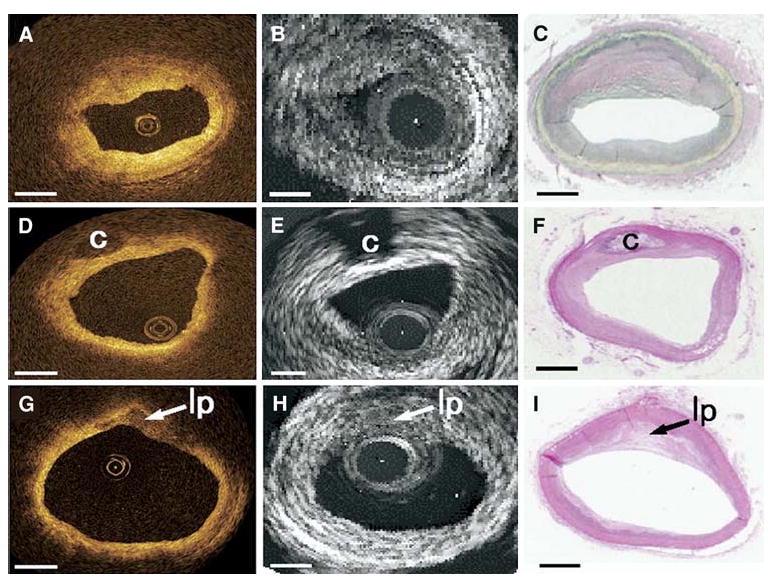
Comparison of the three types of plaque (fibrous, fibrocalcific, and lipid-rich) as identified with OCT, IVUS, and histology. The top row shows homogeneous, signal-rich regions that characterize the fibrous plaque in OCT, which is difficult to differentiate with gray scale IVUS. The middle row shows a fibrocalcific plaque which appears as well-delineated signal-poor regions with sharp borders for OCT and bright echolucent regions in IVUS. Lipid-rich plaques are on the bottom row, which appear as signal-poor regions with diffuse borders on OCT and IVUS (Reproduced with permission from58).
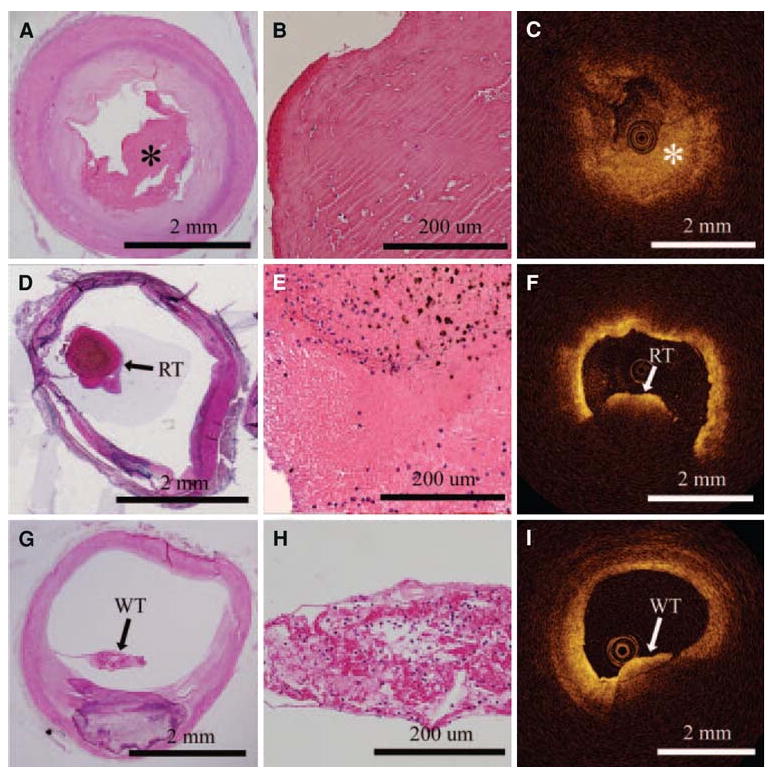
OCT images on the right are correlated with histology images on the left. The top row shows a fibrous clot (asterisk), comprising fibrin and a few red blood cells. The middle row shows a red thrombus by histology, which is evident in the OCT image by the large shadow from the thrombus (light attenuation) that prevents visualization of the entire arterial wall. White thrombus, composed predominantly of platelets, is in the last row. White thrombus can be discriminated from the red thrombus in the OCT image since the entire thickness of the clot and arterial lumen can be seen behind the thrombus.
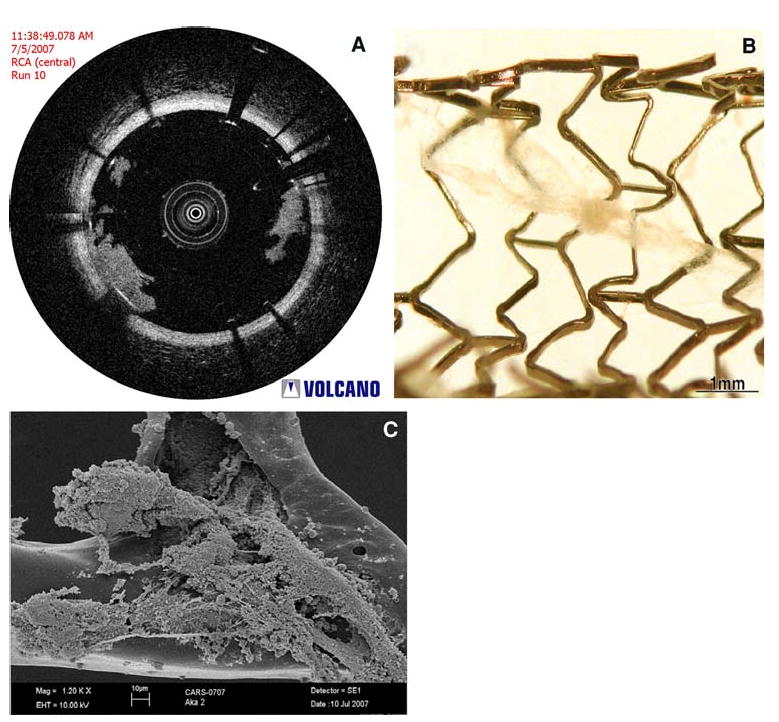
(A) OCT image from an in vivo porcine coronary artery which demonstrates the presence of a white thrombus on a bare metal stent, which was extracted from the coronary artery (B) (courtesy of Volcano Corporation, San Antonio, TX and Rancho Cordova, CA). This material was then imaged with electron microscopy (C), which verified that the structure contains platelets and cellular debris, corresponding to white thrombus (Images courtesy of Dr. Fermin Tio, Texas Veterans Affairs Health System, San Antonio, TX).
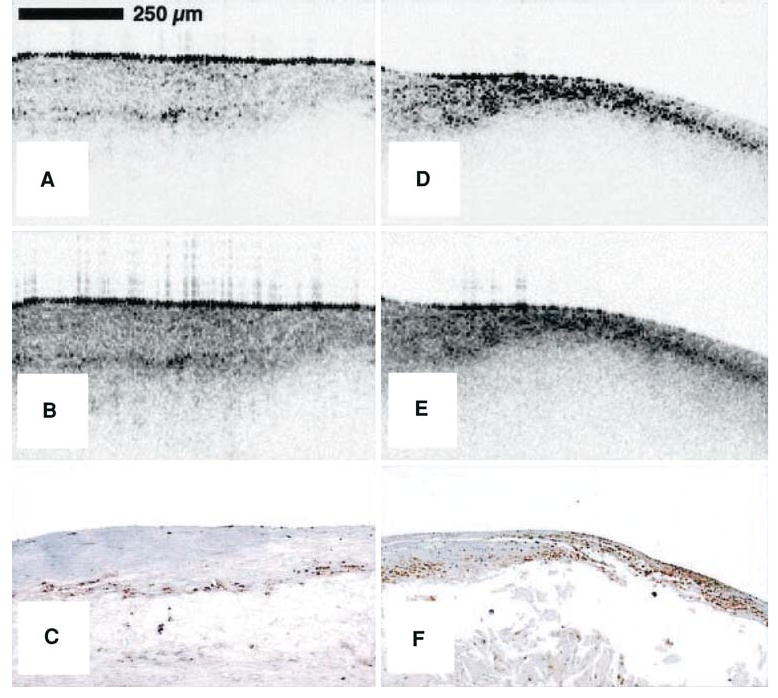
Raw (A) and logarithm base 10 (B) OCT images of a post-mortem fibroatheroma with a low density of macrophages within the fibrous cap. (C) Corresponding histology for A and B (CD68 immunoperoxidase; original magnification ×100). Raw (D) and logarithm base 10 (E) OCT images of a fibroatheroma with a high density of macrophages within the fibrous cap. (F) Corresponding histology for D and E (CD68 immunoperoxidase; original magnification (×100).
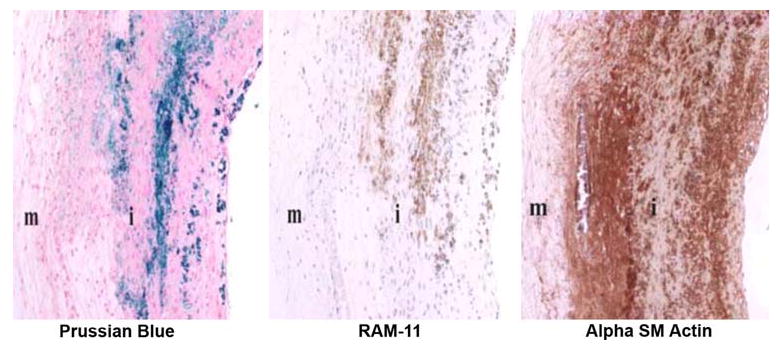
Histologic images of double-balloon injured fat-fed abdominal aorta from a New Zealand white rabbit demonstrating co-localization of macrophages and iron nanoparticles. Left: section stained with Prussian blue for iron; Middle: section stained with RAM-11 for macrophages; Right: section stained for SM actin for SM cells; i = intima; m = media (Reproduced with permission from69).
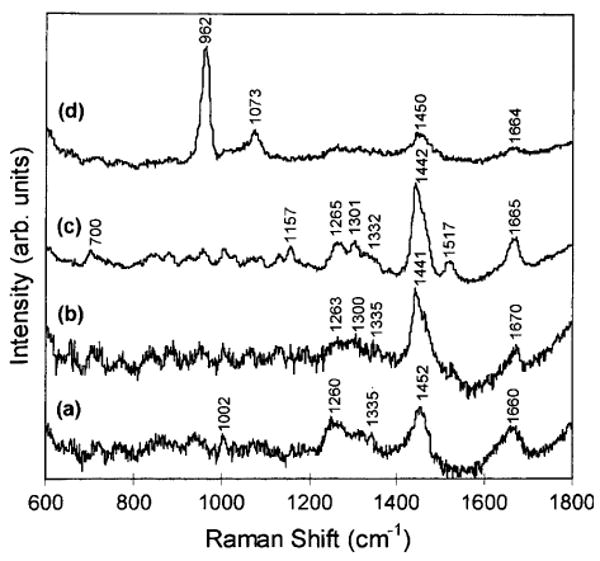
In vitro near-infrared Raman spectra obtained from human coronary artery tissues: (a) non-atherosclerotic, (b) atherosclerotic composed mainly of macrophage foam cells and lipid-laden smooth muscle cells, (c) atherosclerotic covered by a fibrous connective tissue, and (d) calcified (Reproduced with permission from85).
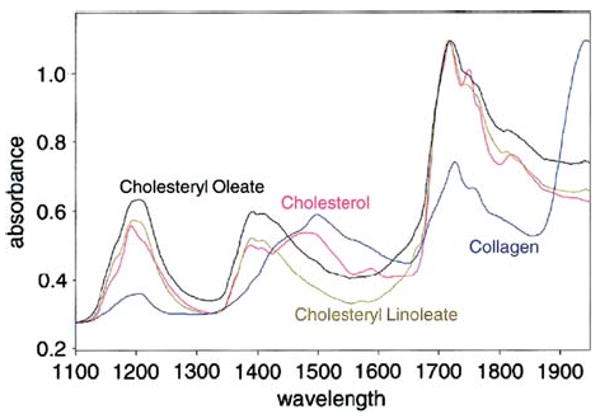
NIR spectra of various pure substances possibly related to plaque vulnerability (Reproduced with permission from89).
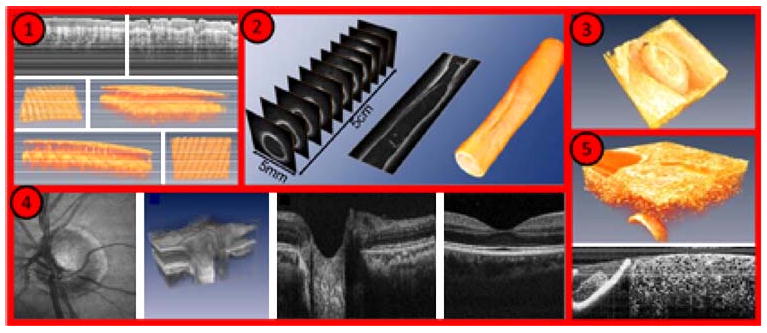
Imaging examples with Fourier Domain-Mode Locked lasers: (1) human skin in vivo, (2) endoscopic intravascular 3D data set of a 5-cm segment of an excised radial artery from a cadaver, (3) heart of a quail embryo, (4) human retina in vivo, (5) high resolution OCT of a cucumber (adapted from http://spie.org/x33321.xml?ArticleID=x33321 ).
(A) Optical coherence tomography images of a fibrous cap, demonstrating difficulty in identifying fibrous cap thickness. (B) The addition of Polarization-sensitive optical coherence tomography (PS-OCT) provides additional contrast between the fibrous cap and the remainder of the plaque allowing a more precise measurement of the fibrous cap thickness (Reproduced with permission from107).
Similar articles
-
Drug-coated balloon without stent implantation for chronic total occlusion of coronary arteries: Description of a new strategy with an optical coherence tomography assistance.Int J Cardiol. 2015 Jul 15;191:75-6. doi: 10.1016/j.ijcard.2015.04.278. Epub 2015 May 2. Int J Cardiol. 2015. PMID: 25965604 No abstract available.
-
Delayed neointimalization on drug-eluting stents--speculation from optical coherence tomography.Circ J. 2009 Dec;73(12):2210-1. doi: 10.1253/circj.cj-09-0792. Circ J. 2009. PMID: 19940371 No abstract available.
-
Drug-eluting stent treatment of left main coronary artery disease: the case for a sirolimus-eluting, autoexpandable alternative. An optical coherence tomography analysis.Int J Cardiol. 2015 Nov 15;199:119-20. doi: 10.1016/j.ijcard.2015.07.006. Epub 2015 Jul 11. Int J Cardiol. 2015. PMID: 26188831 No abstract available.
-
The Role of Vascular Imaging in Guiding Routine Percutaneous Coronary Interventions: A Meta-Analysis of Bare Metal Stent and Drug-Eluting Stent Trials.Cardiovasc Ther. 2015 Dec;33(6):360-6. doi: 10.1111/1755-5922.12160. Cardiovasc Ther. 2015. PMID: 26363283 Review.
-
Algorithmic Approach for Optical Coherence Tomography-Guided Stent Implantation During Percutaneous Coronary Intervention.Interv Cardiol Clin. 2018 Jul;7(3):329-344. doi: 10.1016/j.iccl.2018.03.001. Epub 2018 Jun 29. Interv Cardiol Clin. 2018. PMID: 29983145 Review.
Cited by
-
Effect of glitazones on the progression of coronary artery disease in type 2 diabetes patients.Vasc Health Risk Manag. 2010 Feb 4;6:1-8. Vasc Health Risk Manag. 2010. PMID: 20191077 Free PMC article. Review.
-
Optical coherence contrast imaging using gold nanorods in living mice eyes.Clin Exp Ophthalmol. 2015 May-Jun;43(4):358-66. doi: 10.1111/ceo.12299. Epub 2015 Feb 12. Clin Exp Ophthalmol. 2015. PMID: 24533647 Free PMC article.
References
-
- Camendzind E, Nordman AJ, Briel M, Bucher HC. Safety of drug eluting stents: Insights from a meta-analysis. Presented at the European Society of Cardiology Annual Congress; 2006. Hotline I.
-
- Stone GW, Moses JW, Ellis SG, Schofer J, Dawkins KD, Morice MC, et al. Safety and efficacy of sirolimus- and paclitaxel-eluting coronary stents. N Engl J Med. 2007;356:998–1008. - PubMed
-
- Stettler C, Wandel S, Allemann S, Kastrati A, Morice MC, Schomig A, et al. Outcomes associated with drug-eluting and bare-metal stents: A collaborative network meta-analysis. Lancet. 2007;370:937–48. - PubMed
-
- Rizik DG, Klassen KJ. Assessing the landscape of stent thrombosis: The drug-eluting versus bare-metal stent controversy. Am J Cardiol. 2008;102:4J–11J. - PubMed
-
- Spaulding C. The question of drug-eluting stent safety: Then and now. Am J Cardiol. 2008;102:12J–7J. - PubMed
Publication types
MeSH terms
Substances
Grants and funding
LinkOut - more resources
Full Text Sources
