. 2009 Aug 10;515(5):548-64.
doi: 10.1002/cne.22073.

Bilateral projections from rat MI whisker cortex to the neostriatum, thalamus, and claustrum: forebrain circuits for modulating whisking behavior

Affiliations

Bilateral projections from rat MI whisker cortex to the neostriatum, thalamus, and claustrum: forebrain circuits for modulating whisking behavior

Kevin D Alloway et al. J Comp Neurol. .

Abstract

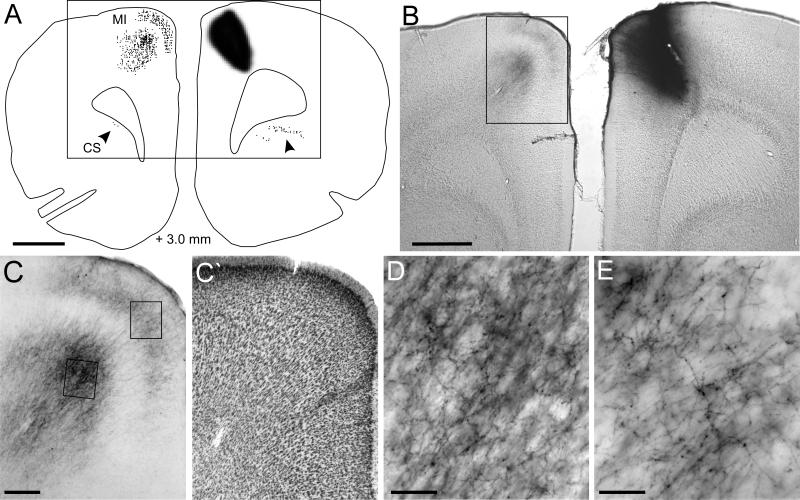
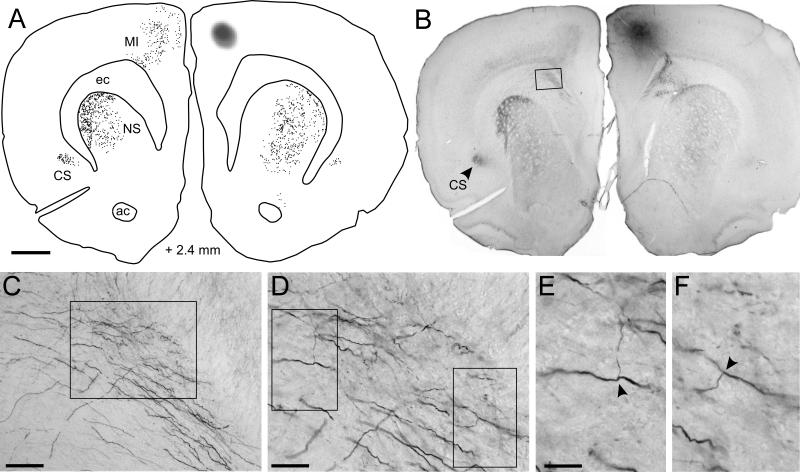
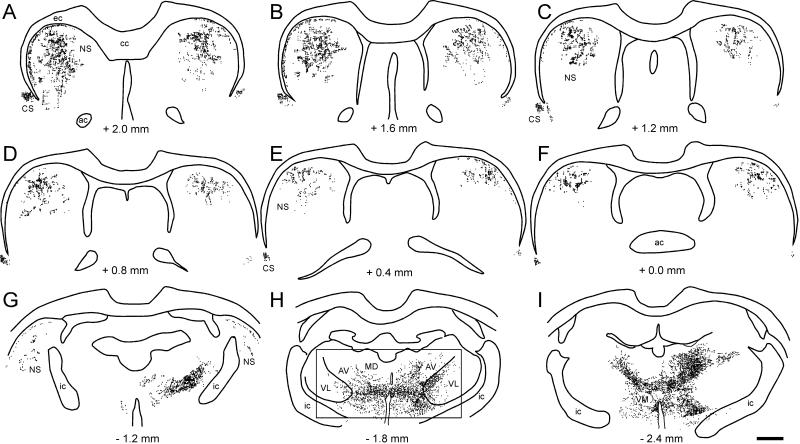
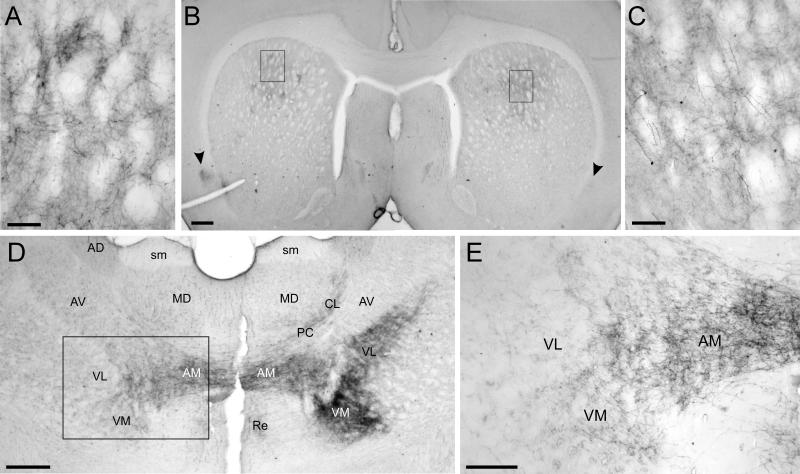
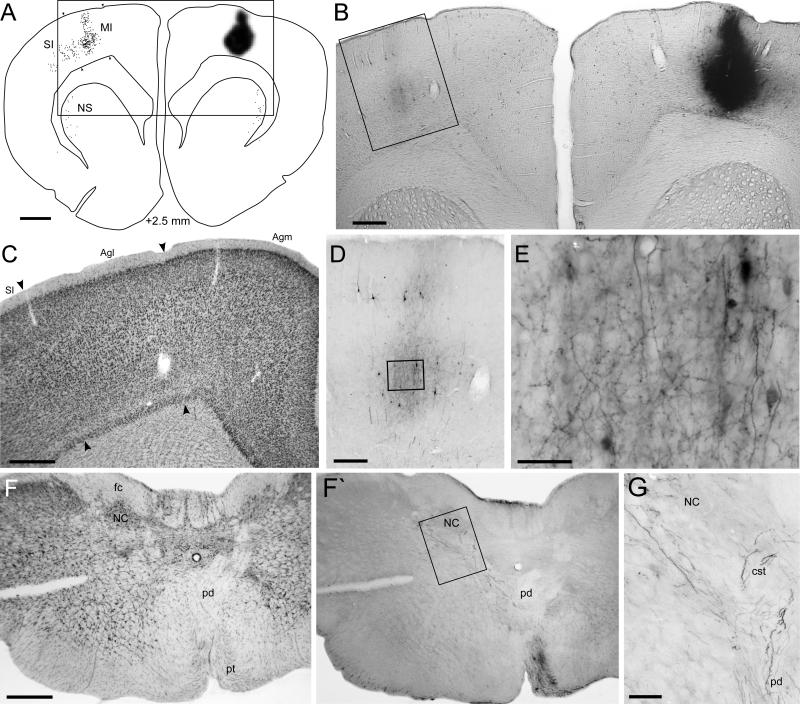
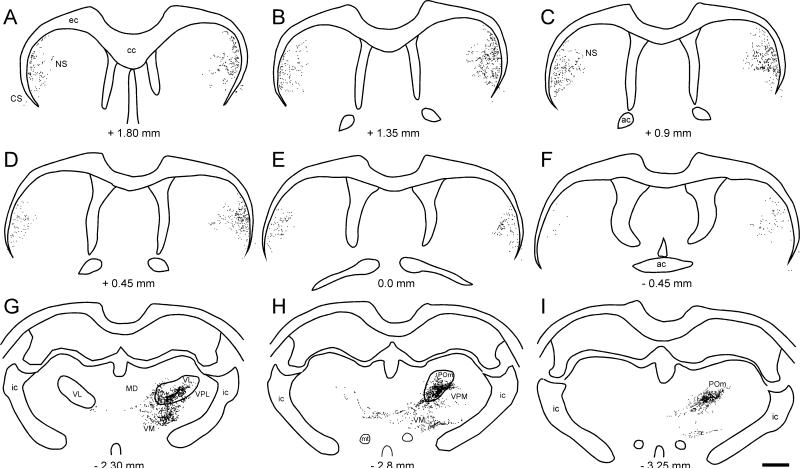
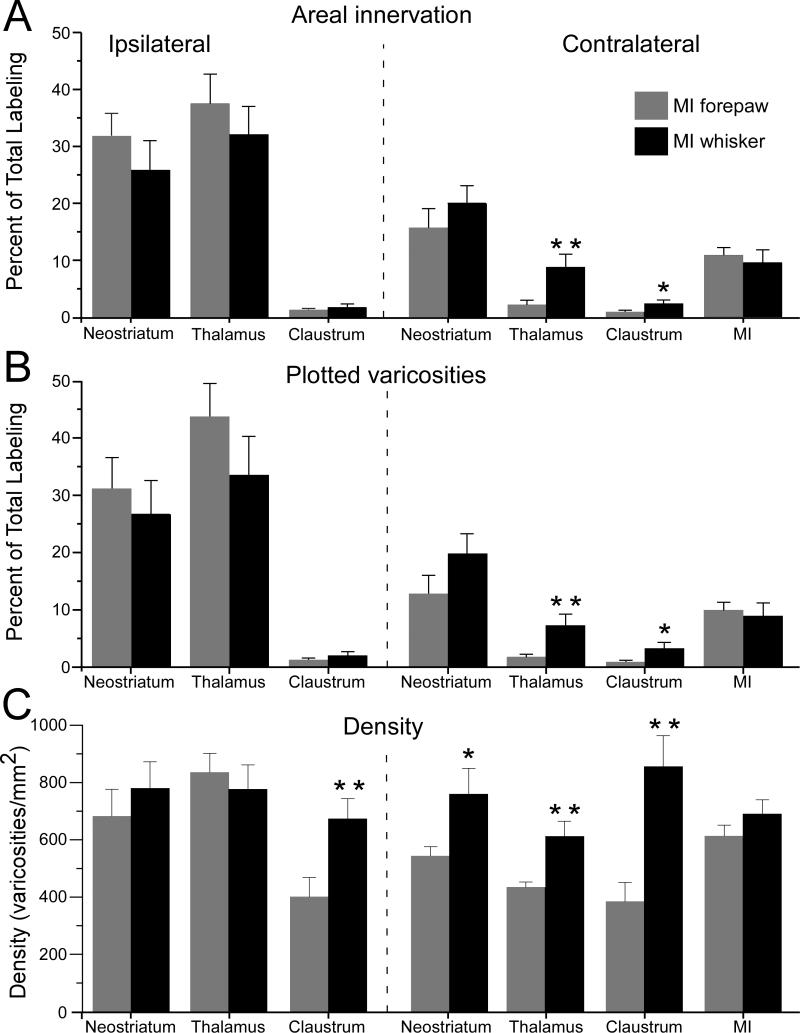
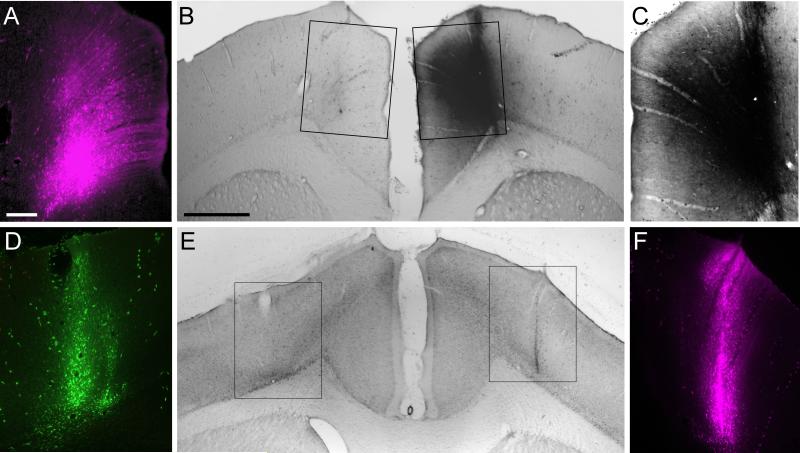
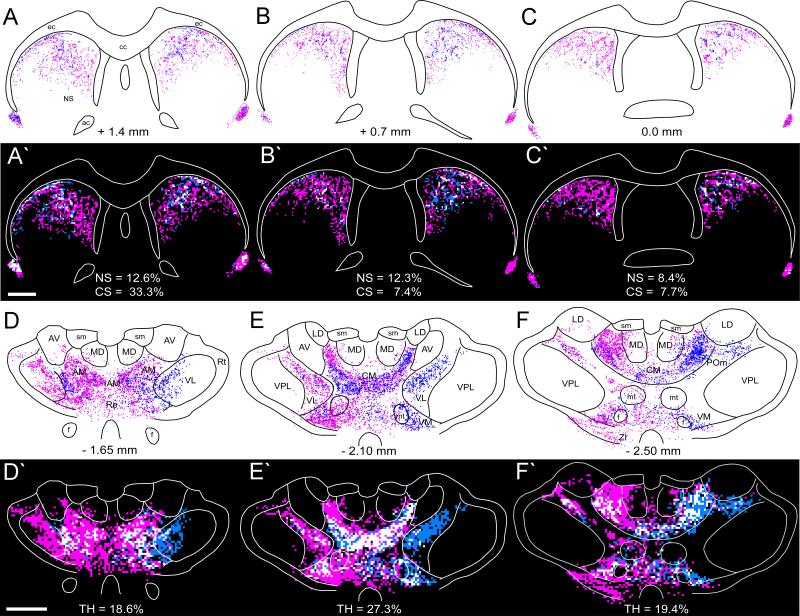
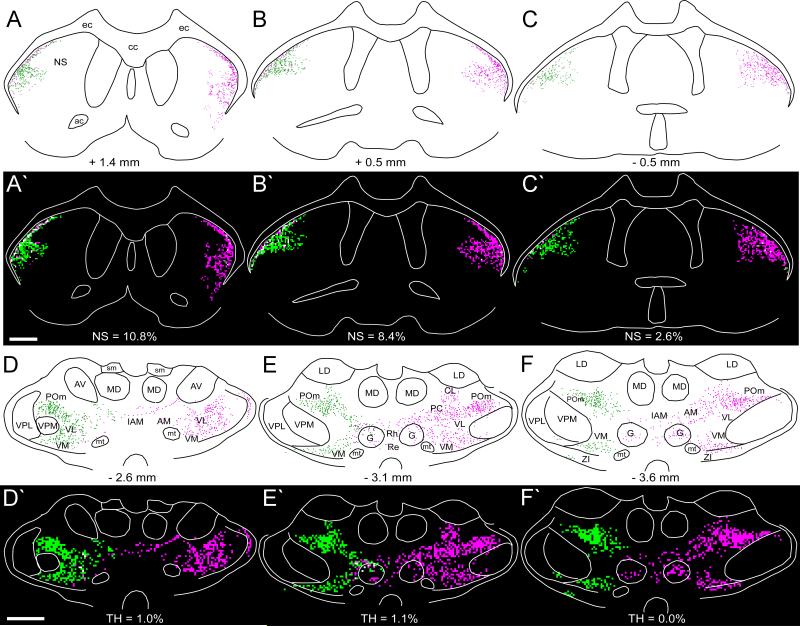
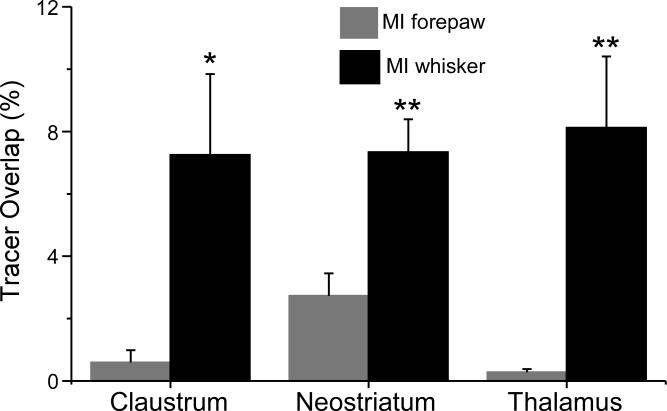
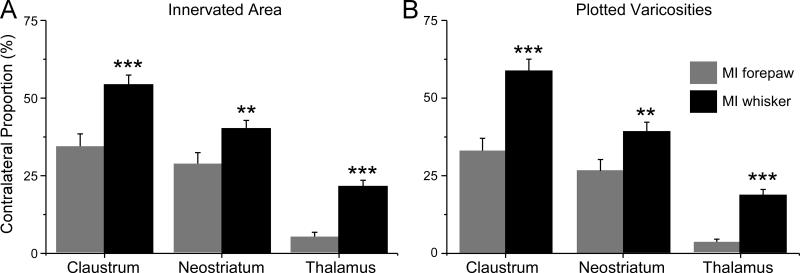
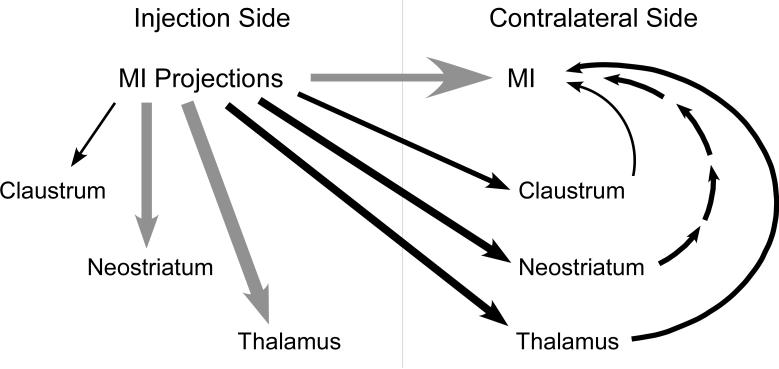
In rats, whisking behavior is characterized by high-frequency synchronous movements and other stereotyped patterns of bilateral coordination that are rarely seen in the bilateral movements of the limbs. This suggests that the motor systems controlling whisker and limb movements must have qualitative or quantitative differences in their interhemispheric connections. To test this hypothesis, anterograde tracing methods were used to characterize the bilateral distribution of projections from the whisker and forepaw regions in the primary motor (MI) cortex. Unilateral tracer injections in the MI whisker or forepaw regions revealed robust projections to the corresponding MI cortical area in the contralateral hemisphere. Both MI regions project bilaterally to the neostriatum, but the corticostriatal projections from the whisker region are denser and more evenly distributed across both hemispheres than those from the MI forepaw region. The MI whisker region projects bilaterally to several nuclei in the thalamus, whereas the MI forepaw region projects almost exclusively to the ipsilateral thalamus. The MI whisker region sends dense projections to the contralateral claustrum, but those to the ipsilateral claustrum are less numerous. By contrast, the MI forepaw region sends few projections to the claustrum of either hemisphere. Bilateral deposits of different tracers in MI revealed overlapping projections to the neostriatum, thalamus, and claustrum when the whisker regions were injected, but not when the forepaw regions were injected. These results suggest that the bilateral coordination of the whiskers depends, in part, on MI projections to the contralateral neostriatum, thalamus, and claustrum.


Figures

Fig. 1
Fig. 1
Callosal projections from the MI whisker region in BN27. A: Reconstruction of the BDA deposit and labeled terminals in the claustrum (arrowheads) and contralateral MI. Rectangle indicates panel B; distance from bregma indicated at bottom. B: Photomicrograph of the BDA deposit and labeled terminals in contralateral MI. Rectangle indicates panel C. C: Laminar pattern of BDA-labeling in MI. Rectangles indicate panels D and E. C’: Adjacent thionin-stained section showing the laminar cytoarchitecture of Agm. D: Labeled axons and varicosities in layer Vb. E: Labeled axons and varicosities in layers II. Scale bars: 1 mm (A, B), 250 μm (C, C’), and 50 μm (D, E).
Fig. 2
Fig. 2
Labeled collaterals in the contralateral external capsule. A: Reconstructed section for BN27 shows the caudal end of the BDA deposit and labeled varicosities in the neostriatum, claustrum, and contralateral MI. B: Photomicrograph of the section in panel A. Arrowhead indicates intense labeling in the contralateral claustrum; rectangle shows the region in panel C. C: Labeled axons in the external capsule; rectangle indicates panel D. D: Magnified view of BDA-labeled axons in the external capsule; rectangles indicate panels E and F. E,F: Labeled axons splitting into collaterals (arrowheads), some of which project to MI. Scale bars: 1 mm (A,B), 100 μm (C), 50 μm (D), and 25 μm (E,F).
Fig. 3
Fig. 3
Bilateral distribution of BDA-labeled varicosities in the neostriatum, claustrum, and thalamus of BN27. Distance from bregma appears below each reconstruction; rectangles indicate regions depicted in Fig 4B and 4D. Scale, 1 mm.
Fig. 4
Fig. 4
Photomicrographs of BDA labeling in the neostriatum, claustrum, and thalamus of BN27. A: Magnified view of BDA-labeled terminals in the contralateral neostriatum. B: Low power view of BDA labeling in the contralateral (left) and ipsilateral (right) neostriatum and claustrum (arrowheads). Rectangles indicate panels A and C. C: Magnified view of BDA-labeled terminals in the ipsilateral neostriatum. D: Low power view of BDA labeling in the thalamus. Rectangle indicates panel E. E: Labeled terminals in contralateral thalamus. Scale bars: 100 μm (A, C), 500 μm (B, D), and 250 μm (E).
Fig. 5
Fig. 5
Projections from the MI forepaw regions in BN56. A: Reconstruction of BDA deposit and labeled terminals in the neostriatum and contralateral MI. Arrowheads indicate the boundaries of Agl. Rectangle indicates panel B; distance from bregma indicated at bottom. B: Photomicrograph of the BDA deposit and labeled terminals in contralateral MI. Rectangle indicates panel D. C: Adjacent thionin-stained section showing the boundaries (arrowheads) of Agl in the left hemisphere. D: Laminar distribution of BDA-labeled projections in the contralateral MI cortex. Rectangle indicates panel E. E: BDA-labeled terminals in contralateral MI. F, F’: Adjacent thionin and BDA-labeled sections through the pyramidal decussation. Rectangle indicates panel G. G: Labeled axons in the corticospinal tract. Scale bars: 1 mm (A), 500 μm (B, C, F, F’), 250 μm (D), 100 μm (G), and 50 μm (E).
Fig. 6
Fig. 6
Bilateral distribution of BDA-labeled varicosities in the neostriatum, claustrum, and thalamus of BN56. Distance from bregma appears below each diagram. Scale, 1 mm.
Fig. 7
Fig. 7
Bargraphs depicting the relative distribution of bilateral projections in cases that received a unilateral tracer injection in the MI whisker (n = 7) or forepaw (n = 7) regions. A: Mean proportion of labeled area in each of 7 brain regions. For each injected rat, the sum of the labeled bins (50 μm2) across the 7 brain regions equals 100%. B: Mean proportion of plotted varicosities in each of 7 brain regions. For each rat, the sum of the labeled varicosities across the 7 brain regions equals 100%. C: Density of plotted varicosities in each brain region. Brackets represent SEM; asterisks indicate significant differences between the MI whisker and MI forepaw groups (* p < 0.05, ** p < 0.01).
Fig. 8
Fig. 8
Bilateral tracer injections in the MI whisker (top panels) and forepaw (bottom panels) regions. A: FR injection in the left MI whisker area in BN53. B: Tracer injections in the left and right hemispheres of BN53 as seen in conventional light microscopy. Rectangles indicate panels A and C. C: BDA deposit in the right MI whisker area in BN53. D,E,F: AF (left) and FR (right) injections in the MI forepaw regions in BN16 shown as in the top panels. Scale bars: 250 μm (A, C, D, F) and 1.0 mm (B, E).
Fig. 9
Fig. 9
Bilateral distribution of FR- and BDA-labeled projections from the MI whisker regions in BN53. A: Reconstructions of BDA- (blue dots) and FR- (magenta dots) labeled varicosities in the neostriatum and claustrum. The distance from bregma appears below each section. A’: Overlap analysis based on a grid of 50 μm2 bins. Bins that contained BDA- or FR-labeled varicosities are colored blue or magenta, respectively; those that contained projections from both injections are white. The proportion of white bins in the neostriatum (NS) and claustrum (CL) of each section are expressed as percentages. B, B’: Distribution of labeled terminals in the thalamus of BN53. Reconstructions and overlap analysis presented as in panels A and A’. Scale bars, 1 mm.
Fig.10
Fig.10
Bilateral distribution of AF- and FR-labeled projections from the MI forepaw regions in BN16. AF and FR labeled varicosities shown as green and magenta, respectively. All other aspects of the labeling patterns (A,B) and overlap analysis (A’,B’) are shown as in Figure 9. Scale bars, 1 mm.
Fig. 11
Fig. 11
Mean amount of tracer overlap in the claustrum, neostriatum, and thalamus after depositing tracers bilaterally into the MI whisker (n = 6) or forepaw (n = 6) regions. Tracer overlap represents the proportion of 50 μm2 bins that contain labeled projections from both MI tracer injections. Brackets represent SEM; asterisks indicate significant differences between the MI whisker and MI forepaw groups (* p < 0.05, ** p < 0.01).
Fig. 12
Fig. 12
Proportion of labeling in the claustrum, neostriatum, and thalamus that was located on the contralateral side after injecting the MI whisker (n = 13) or forepaw (n = 13) regions. The sum of contralateral and ipsilateral labeling equals 100% for each brain region. A: Mean proportion of labeled area on the contralateral side. B: Mean proportion of plotted varicosities on the contralateral side. Brackets represent SEM; asterisks indicate significant differences between the MI whisker and MI forepaw groups (** p < 0.01, *** p < 0.001).
Fig. 13
Fig. 13
Hypothetical strength of projections from the MI whisker and forepaw regions. Line thickness is proportional to the relative extent and number of projections to the claustrum, neostriatum, thalamus and contralateral MI. Gray lines indicate projections from the whisker and forepaw regions that are equally strong; black lines indicate projections from the MI whisker region that are stronger than the corresponding projections from the MI forepaw region. Multisynaptic projections from neostriatum to MI cortex are indicated by a sequence of arrows on the contralateral side.

Similar articles

Cited by

References

    1. Alloway KD, Crist J, Mutic JJ, Roy SA. Corticostriatal projections from rat barrel cortex have an anisotropic organization that correlates with vibrissal whisking behavior. J Neurosci. 1999;19:10908–10922. - PMC - PubMed
    1. Alloway KD, Lou L, Nwabueze-Ogbo F, Chakrabarti S. Topography of cortical projections to the dorsolateral neostriatum in rats: multiple overlapping sensorimotor pathways. J Comp Neurol. 2006;499:33–48. - PubMed
    1. Alloway KD, Mutic JJ, Hoover JE. Divergent corticostriatal projections from a single cortical column in the somatosensory cortex of rats. Brain Res. 1998;785:341–346. - PubMed
    1. Alloway KD, Olson ML, Smith JB. Contralateral corticothalamic projections from MI whisker cortex: Potential route for modulating hemispheric interactions. J Comp Neurol. 2008;510:100–116. - PMC - PubMed
    1. Balleine BW, Delgado MR, Hikosaka O. The role of the dorsal striatum in reward and decision-making. J Neurosci. 2007;27:8161–8165. - PMC - PubMed

Publication types