

Malignant tumors and forensics--dilemmas and proposals
- PMID: 19480018
- PMCID: PMC2702737
- DOI: 10.3325/cmj.2009.50.218
Malignant tumors and forensics--dilemmas and proposals
Abstract
Aim: To evaluate the effect of genetic instability and degradation in archived histology samples from cancerous tumors and to investigate the validity of short tandem repeat (STR) typing of these samples and its potential effect on human identification.
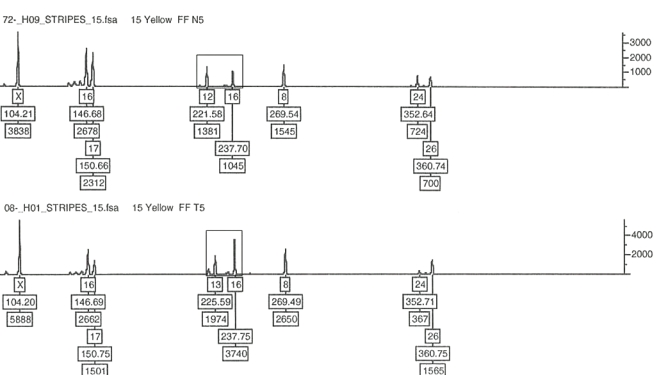
Methods: Two hundred and twenty eight slides of archival pathology tissues from 13 different types of malignant tumors were compared with healthy tissues from the same individuals. DNA analysis was performed using standard techniques for forensic STR analysis, PowerPlex16 and Identifiler on 2 distinct sample sets. Genetic instability was assessed by comparing reference tissues with cancerous tissues derived from the same individual. Loss of heterozygosity, a > or =50% reduction in heterozygosity ratio between healthy and diseased samples, and microsatellite instability, the presence of an additional allele not present in reference tissue, were assessed. The quality of profiles obtained with respect to completeness among the archived samples and degradation using the 2 platforms were also compared.
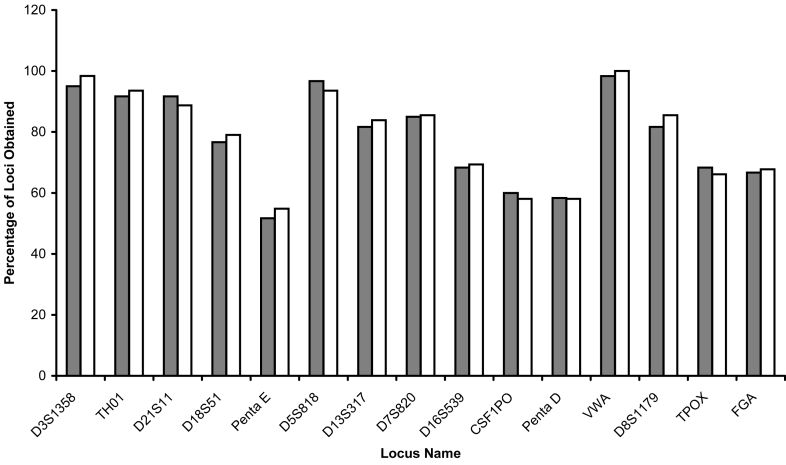
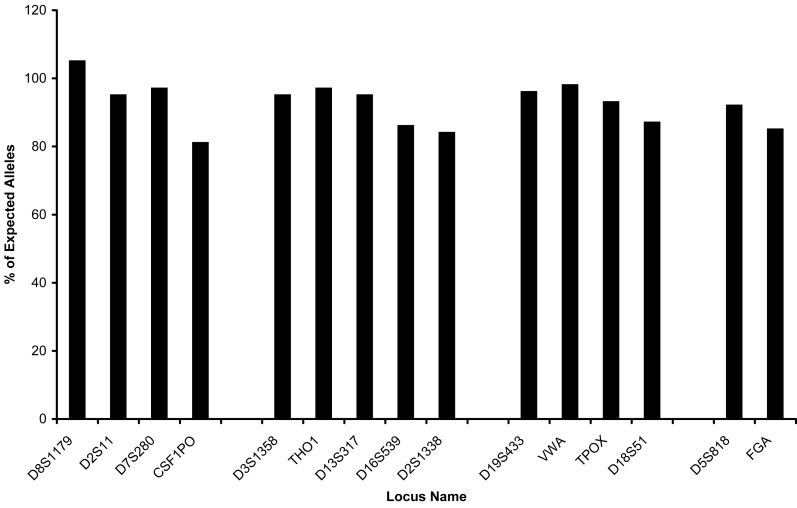
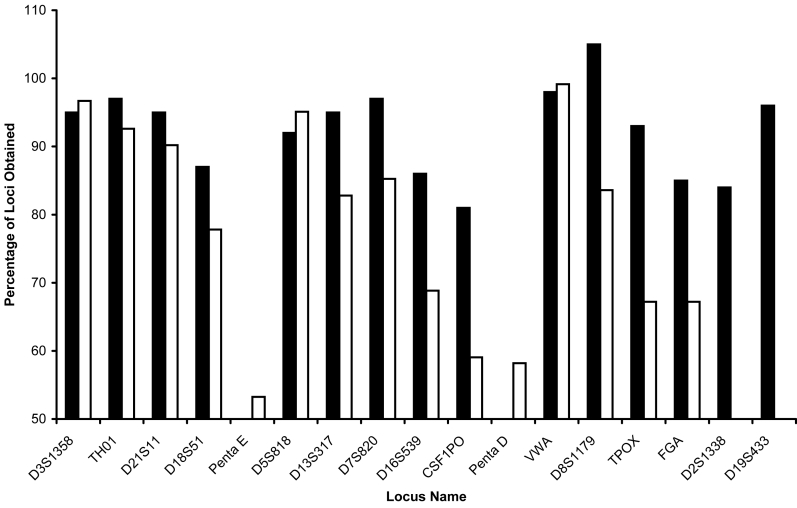
Results: Profiles obtained using the Identifiler system were generally more complete, but showed 3-fold higher levels of instability (86%) than those obtained using PowerPlex 16 (27%). Instances of genetic instability were distributed throughout all loci in both multiplex STR systems.
Conclusion: After having compared 2 widely used forensic chemistries, we suggest individual validation of each kit for use with samples likely to exhibit instability combined with fixation induced degradation or artifact. A "one size fits all" approach for interpretation of these samples among commercially available multiplexes is not recommended.
Figures


Similar articles
-
Cancerous tissues in forensic genetic analysis.Genet Test. 2007 Winter;11(4):397-400. doi: 10.1089/gte.2007.0004. Genet Test. 2007. PMID: 18294056
-
Disease-Induced Anomalous Human Microsatellite DNA - Implication in Forensic DNA Typing.Forensic Sci Rev. 2006 Jan;18(1):43-58. Forensic Sci Rev. 2006. PMID: 26247109 Review.
-
STR typing of ductal adenocarcinomas of the pancreas and healthy control tissue in 18 individuals.Leg Med (Tokyo). 2004 Jul;6(3):170-3. doi: 10.1016/j.legalmed.2004.01.001. Leg Med (Tokyo). 2004. PMID: 15231286
-
Evaluation of Promega PowerSeq™ Auto/Y systems prototype on an admixed sample of Rio de Janeiro, Brazil: Population data, sensitivity, stutter and mixture studies.Forensic Sci Int Genet. 2021 Jul;53:102516. doi: 10.1016/j.fsigen.2021.102516. Epub 2021 Apr 6. Forensic Sci Int Genet. 2021. PMID: 33878618
-
Cancer and forensic microsatellites.Forensic Sci Med Pathol. 2008;4(1):60-6. doi: 10.1007/s12024-008-9027-y. Epub 2008 Feb 2. Forensic Sci Med Pathol. 2008. PMID: 19291472 Review.
Cited by
-
InDEL instability in two different tumoral tissues and its forensic significance.Forensic Sci Med Pathol. 2024 Dec;20(4):1241-1250. doi: 10.1007/s12024-024-00808-5. Epub 2024 Apr 3. Forensic Sci Med Pathol. 2024. PMID: 38568352 Free PMC article.
-
Effect of Carcinomas on Autosomal Trait Screening: A Review Article.Curr Issues Mol Biol. 2023 Sep 4;45(9):7275-7285. doi: 10.3390/cimb45090460. Curr Issues Mol Biol. 2023. PMID: 37754244 Free PMC article. Review.
-
Comparison of the Allelic Alterations between InDel and STR Markers in Tumoral Tissues Used for Forensic Purposes.Medicina (Kaunas). 2021 Mar 2;57(3):226. doi: 10.3390/medicina57030226. Medicina (Kaunas). 2021. PMID: 33801242 Free PMC article.
-
DNA isolated from formalin-fixed paraffin-embedded healthy tissue after 30 years of storage can be used for forensic studies.Forensic Sci Med Pathol. 2021 Mar;17(1):47-57. doi: 10.1007/s12024-020-00327-z. Epub 2020 Nov 7. Forensic Sci Med Pathol. 2021. PMID: 33159288
References
-
- Alonso A, Alves C, Suarez-Mier MP, Albarran C, Pereira L, Fernandez de Simon L, et al. Mitochondrial DNA haplotyping revealed the presence of mixed up benign and neoplastic tissue sections from two individuals on the same prostatic biopsy slide. J Clin Pathol. 2005;58:83–6. doi: 10.1136/jcp.2004.017673. - DOI - PMC - PubMed
-
- Popiolek DA, Prinz MK, West AB, Nazzaruolo BL, Estacio SM, Budimlija ZM. Multiplex DNA short tandem repeat analysis. A useful method for determining the provenance of minute fragments of formalin-fixed, paraffin-embedded tissue. Am J Clin Pathol. 2003;120:746–51. doi: 10.1309/MGW2XKFT0NYQCUHW. - DOI - PubMed
-
- Rubocki RJ, Duffy KJ, Shepard KL, McCue BJ, Shepherd SJ, Wisecarver JL. Loss of heterozygosity detected in a short tandem repeat (STR) locus commonly used for human DNA identification. J Forensic Sci. 2000;45:1087–9. - PubMed
-
- Schwark T, Bachmann C, von Wurmb-Schwark N. STR typing of ductal adenocarcinomas of the pancreas and healthy control tissue in 18 individuals. Leg Med (Tokyo) 2004;6:170–3. - PubMed
MeSH terms
LinkOut - more resources
Full Text Sources