

Review
doi: 10.1021/cr900021w.
IMP dehydrogenase: structure, mechanism, and inhibition
Affiliations
- PMID: 19480389
- PMCID: PMC2737513
- DOI: 10.1021/cr900021w
Item in Clipboard
Review
IMP dehydrogenase: structure, mechanism, and inhibition
Chem Rev.
2009 Jul.
No abstract available
Figures

A. The CBS subdomain rotates relative to the barrel domain. IMP is shown in spacefill. The CBS subdomain is completely ordered in the crystal structure of S. pyogenes IMPDH (blue, 1zfj); only part of the CBS subdomain is visible in the structures of Chinese hamster IMPDH (magenta, 1jr1) and hIMPDH2 (green, 1b3o). The flap is disordered in all structures, as are portions of the N- and C-termini. B. The tetramer structure of S. pyogenes IMPDH showing square planar geometry. SD, subdomain; C. Side view of B, showing dimer interactions. All molecular graphics images were created using the UCSF Chimera package from the Resource for Biocomputing, Visualization, and Informatics at the University of California, San Francisco (supported by NIH P41 RR-01081) .

A. T. foetus IMPDH. magenta, Cys319 loop; slate blue, flap; green, C-terminal segment in E•MZP (1pvn); blue, C-terminal segment in E•IMP•TAD (the rest is disordered). Interactions between K+ (orange) and the carbonyl oxygens of Gly314, Gly316, Cys319, Glu485, Gly486 and Gly487 are shown. (′) designates residues from the adjacent subunit. B. S. pyogenes E•IMP (1ZFJ); the C-terminal segment is magenta, the Cys319 loop and its subunit are green and the putative NH4+ is firebrick; one of the ligands is a water (red). The K+ site of T. foetus E•MZP (blue, 1PVN) is shown for comparison in both panels, K+ in orange. C. Comparison of K+ and Na+ binding in T. foetus IMPDH. K+ site, blue (1PVN). Na+ site, green. Na+, gold. (1ME7). Note how the Cys319 loop and C-terminal segment contract.

The structure of T. foetus E•MZP (1pvn) is shown in blue with the K+ in orange for comparison. A. The Cys139 loop can move like a hinge. The structure of B. burgdorferi E•Pi (1EEP) is shown in green. Note that this conformation is incompatible with K+ binding. B. The Cys319 loop can adopt other conformations. The structure of the 6-Cl-IMP adduct of IMPDH2 (1jcn) is shown in magenta. Note that both the flap (residues 402-439) and the K+ site are disrupted.

A. The IMP site of T. foetus IMPDH from the E•IMP•TAD complex (1lrt). Residues within 5 Å of IMP are shown, with hydrogen bonds depicted in gold. IMP is shown in coral. Residues are colored by percent conservation of most common residue: cyan, 9%; tan, 55%; magenta, 100%. The alignment includes sequences of 444 IMPDHs . B. The IMP and NAD sites of T. foetus IMPDH from the E•IMP•TAD complex (1lrt) is shown in surface rendering while the flap from the closed conformation (1pvn) is shown in ribbon. Residues 409, 431, 432 and the side chains of 319 and 414 (T. foetus numbering) have been removed so that IMP can be seen. Note that the flap binds in the same site as the dinucleotide. In contrast to the IMP site, and despite these multiple functional constraints, both the flap and the dinucleotide site are highly diverged. Panel B is modified from reference with permission.

The following complexes of T. foetus IMPDH are shown: A. E•SO4-2 (PDB accession number 1ak5), model for apoenzyme . B. E•IMP (1me9) . C. E•IMP•TAD (1lrt), model for E•IMP•NAD+ 95. D. E•RVP•Na+ (1ME8), model for E-XMP*open . F. E•MZP•K+ (1pvn), model for E-XMP*closed . G. E•XMP . Color key: monomer with active site, blue; adjacent monomer, dark blue; Cys319 loop (residues 313-328), firebrick; flap (residues 412-432), dark magenta; IMP, coral; TAD, green; RVP, pink; MZP, pink; XMP, coral; K+, orange sphere; Na+, gold sphere. Residues 262-268 have been omitted from panels D and G to permit a view of Asp261. In addition, residues 14-27(adjacent monomer) were omitted in panels D, F and G for better visualization of the adenosine subsite. A second K+, unique to T. foetus IMPDH, was also omitted from all panels.

If the closed conformation is favored, the first inhibitor (T = tiazofurin) shifts the equilibrium to the open conformation, allowing the second inhibitor (ADP) to bind more tightly.

The units for the rate constants are s-1. Reprinted from reference with permission.

A. Correlation of Ki and kcat/Km*Km. Kis GMP (○), Kis XMP (◊), Ki MMP (●). Reprinted from reference with permission. B. E-XMP* modeled into the E•MZP structure (1pvn). Reprinted from reference with permission.

The Bronsted β values are 1.1± 0.3; R=0.9, including the hydroxyurea and 0.7 ± 0.3; R=0.85, without hydroxyurea (not shown). Similar β values are obtained when the values of pKa are normalized for the number of equivalent protons. Reprinted from reference with permission.

(A) The hydrolysis of E-XMP* with Arg418 acting as the general base catalyst. Red denotes atoms treated with QM; blue denotes atoms treated with MM. (B) The free energy landscape for the Arg418 pathway. R, reactant; TS, transition state; P, product. The x-axis denotes the difference between the distances of the migrating proton between the hydrolytic water and the NH group of Arg418, where 0.0 is the midpoint between the two acceptors; the y-axis specifies the progress of nucleophillic attack, where 0.0 is the midpoint between the original position of the nucleophillic oxygen and the final position. The transition state is the highest point in the energy landscape. Here, the proton has moved past the midpoint and is now associated with Arg418. In contrast, nucleophillic attack has yet to begin. (C) The transition state structure for the Arg418 pathway. Reprinted from reference with permission.
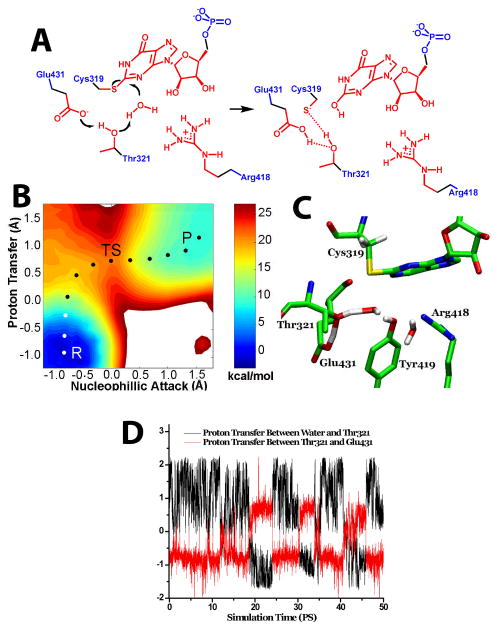
(A) The hydrolysis of E-XMP* with Thr321 acting as the general base catalyst. Color key as described above. (B) The free energy landscape of the Thr321 pathway, with axes as described above, except that the second proton acceptor is the OH of Thr321. As above, proton transfer is virtually complete at the transition state, while nucleophillic attack has just reached the reaction midpoint. (C) The corresponding transition state structure. (D) The correlation between proton transfer from water to Thr321 and proton transfer from Thr321 and Glu431. Atoms treated as described in Figure 1. The reaction coordinate for the proton transfer between water and Thr321 was set as the distance traversed by the proton as it moves between the oxygen of water to the oxygen of Thr321; the reaction coordinate for the proton transfer between Thr321 and Glu431 was set as the distance traversed by the proton that moves between the oxygen of Thr321 and the oxygen of Glu431. Reprinted from reference with permission.

A. The putative general base Arg418 in IMPDH; B. A positively charged Arg in the substrate binding site of trypsin. Note that the putative general base has fewer potential hydrogen bonding interactions.
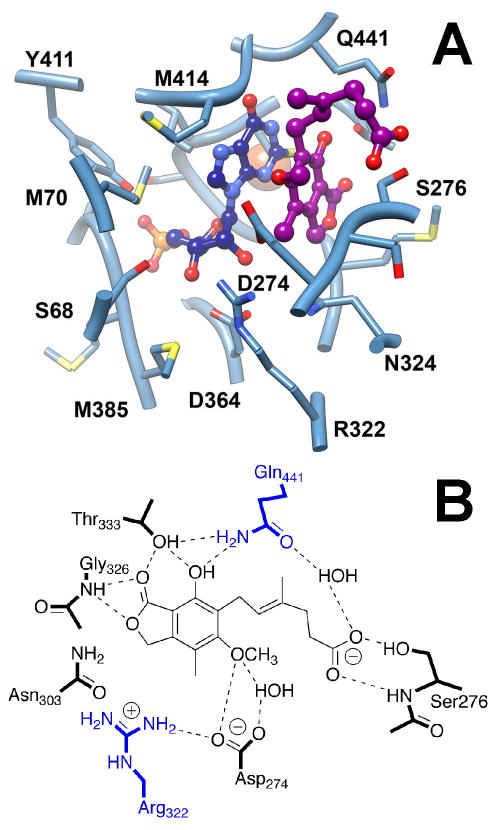
(1jr1). Enzyme is shown in slate blue. XMP* is navy, MPA is dark magenta, potassium is orange. The residues within 4.0 Å of the XMP* and MPA are shown. Chinese hamster IMPDH type 2 numbering is used (identical to human IMPDH type 2). Arg322 and Gln441 are analogous to Lys130 and Glu, respectively, in T. foetus IMPDH. B. Interactions of MPA. Modified from reference with permission.

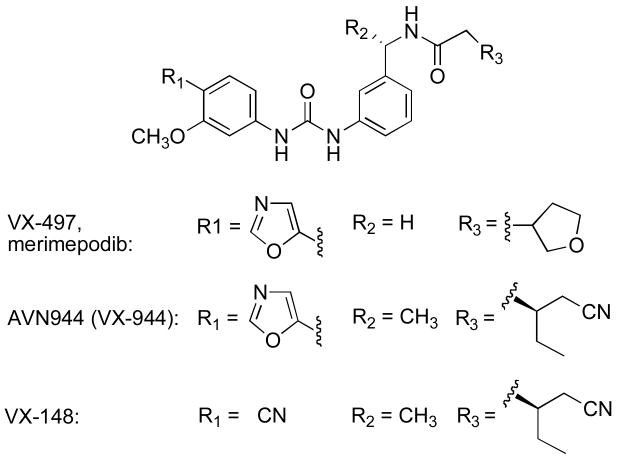
A. The structure of E-XMP*•merimepodib is shown (coordinates courtesy of Marc Jacobs). Residues within 4 Å of the ligands are displayed. Merimepodib is depicted in coral, XMP* in cyan. Gold lines indicate hydrogen bonds. Hydrogen bonds are shown in gold. B. Spacefill depiction of the drug binding site. The surfaces of His253 and Phe282, which sandwich the adenine ring of NAD+/NADH, are shown in green. C. Interactions of phenyl-oxazole urea. Modified from reference with permission.

A. The positions of the disease associated mutations are depicted on a monomer of IMPDH from S. pyogenes, which corresponds to the canonical IMPDH1(514) (1ZFJ); note that the CBS domains are disordered in the structure of human IMPDH1 (1JCN), so that several of the positions of mutation are not observed). Magenta denotes mutations that are clearly pathogenic; red, likely pathogenic; green, possibly pathogenic . B. Schematic of the hIMPDH2 variants produced by alternative splicing. Modified from reference with permission.

The commonly occurring guanine nucleotide biosynthetic and salvage reactions are shown, as is the adenine nucleotide biosynthetic pathway. The IMPDH reaction is depicted in blue. R5P, ribose 5′-monphosphate; NK, nucleoside kinase; HPRT, hypoxanthine phosphoribosyl transferase; XPRT, xanthine phosphoribosyl transferase; GPRT, guanine phosphoribosyl transferase; GMPR, guanosine 5′-monophosphate reductase; ADSS, adenylosuccinate synthetase; ADSL, adenylosuccinate lyase.

Inhibitory complexes are shown in blue. Since most assays are performed at saturating concentrations of IMP, a NAD analog can bind to both E•IMP and E-XMP*, and therefore will display noncompetitive inhibition.


a. antagonize ADP binding. b. bind in the nicotinamide subsite and do not interact with ADP.


References
Publication types
MeSH terms
Substances
Grants and funding
LinkOut - more resources
Full Text Sources
Other Literature Sources
Molecular Biology Databases
