Measure of synonymous codon usage diversity among genes in bacteria
- PMID: 19480720
- PMCID: PMC2697163
- DOI: 10.1186/1471-2105-10-167
Measure of synonymous codon usage diversity among genes in bacteria
Abstract
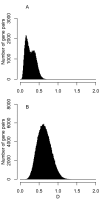
Background: In many bacteria, intragenomic diversity in synonymous codon usage among genes has been reported. However, no quantitative attempt has been made to compare the diversity levels among different genomes. Here, we introduce a mean dissimilarity-based index (Dmean) for quantifying the level of diversity in synonymous codon usage among all genes within a genome.
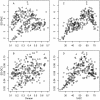
Results: The application of Dmean to 268 bacterial genomes shows that in bacteria with extremely biased genomic G+C compositions there is little diversity in synonymous codon usage among genes. Furthermore, our findings contradict previous reports. For example, a low level of diversity in codon usage among genes has been reported for Helicobacter pylori, but based on Dmean, the diversity level of this species is higher than those of more than half of bacteria tested here. The discrepancies between our findings and previous reports are probably due to differences in the methods used for measuring codon usage diversity.
Conclusion: We recommend that Dmean be used to measure the diversity level of codon usage among genes. This measure can be applied to other compositional features such as amino acid usage and dinucleotide relative abundance as a genomic signature.
Figures


Similar articles
-
Absence of translationally selected synonymous codon usage bias in Helicobacter pylori.Microbiology (Reading). 2000 Apr;146 ( Pt 4):851-860. doi: 10.1099/00221287-146-4-851. Microbiology (Reading). 2000. PMID: 10784043
-
Quantifying the species-specificity in genomic signatures, synonymous codon choice, amino acid usage and G+C content.Gene. 2003 Jun 5;311:35-42. doi: 10.1016/s0378-1119(03)00581-x. Gene. 2003. PMID: 12853136
-
Synonymous codon usage in Pseudomonas aeruginosa PA01.Gene. 2002 May 1;289(1-2):131-9. doi: 10.1016/s0378-1119(02)00503-6. Gene. 2002. PMID: 12036591
-
Comparison of correspondence analysis methods for synonymous codon usage in bacteria.DNA Res. 2008 Dec;15(6):357-65. doi: 10.1093/dnares/dsn028. Epub 2008 Oct 21. DNA Res. 2008. PMID: 18940873 Free PMC article.
-
Detecting anomalous gene clusters and pathogenicity islands in diverse bacterial genomes.Trends Microbiol. 2001 Jul;9(7):335-43. doi: 10.1016/s0966-842x(01)02079-0. Trends Microbiol. 2001. PMID: 11435108 Review.
Cited by
-
Identification and characterization of carboxyl esterases of gill chamber-associated microbiota in the deep-sea shrimp Rimicaris exoculata by using functional metagenomics.Appl Environ Microbiol. 2015 Mar;81(6):2125-36. doi: 10.1128/AEM.03387-14. Epub 2015 Jan 16. Appl Environ Microbiol. 2015. PMID: 25595762 Free PMC article.
-
Dependency of codon usage on protein sequence patterns: a statistical study.Theor Biol Med Model. 2014 Jan 10;11:2. doi: 10.1186/1742-4682-11-2. Theor Biol Med Model. 2014. PMID: 24410898 Free PMC article.
-
Codon-based indices for modeling gene expression and transcript evolution.Comput Struct Biotechnol J. 2021 Apr 22;19:2646-2663. doi: 10.1016/j.csbj.2021.04.042. eCollection 2021. Comput Struct Biotechnol J. 2021. PMID: 34025951 Free PMC article. Review.
-
Human Retrovirus Codon Usage from tRNA Point of View: Therapeutic Insights.Bioinform Biol Insights. 2013 Oct 10;7:335-45. doi: 10.4137/BBI.S12093. eCollection 2013. Bioinform Biol Insights. 2013. PMID: 24151425 Free PMC article.
-
Variation in global codon usage bias among prokaryotic organisms is associated with their lifestyles.Genome Biol. 2011 Oct 27;12(10):R109. doi: 10.1186/gb-2011-12-10-r109. Genome Biol. 2011. PMID: 22032172 Free PMC article.
References
-
- Sharp PM, Cowe E, Higgins DG, Shields DC, Wolfe KH, Wright F. Codon usage patterns in Escherichia coli, Bacillus subtilis, Saccharomyces cerevisiae, Schizosaccharomyces pombe, Drosophila melanogaster and Homo sapiens; a review of the considerable within-species diversity. Nucleic Acids Res. 1988;16:8207–8211. doi: 10.1093/nar/16.17.8207. - DOI - PMC - PubMed
-
- Lobry JR. Asymmetric substitution patterns in the two DNA strands of bacteria. Mol Biol Evol. 1996;13:660–665. - PubMed
Publication types
MeSH terms
Substances
LinkOut - more resources
Full Text Sources

