. 2009 Jun;84(6):760-70.
doi: 10.1016/j.ajhg.2009.05.002. Epub 2009 May 28.

Mutations in the heparan-sulfate proteoglycan glypican 6 (GPC6) impair endochondral ossification and cause recessive omodysplasia

Affiliations

Mutations in the heparan-sulfate proteoglycan glypican 6 (GPC6) impair endochondral ossification and cause recessive omodysplasia

Ana Belinda Campos-Xavier et al. Am J Hum Genet. 2009 Jun.

Abstract

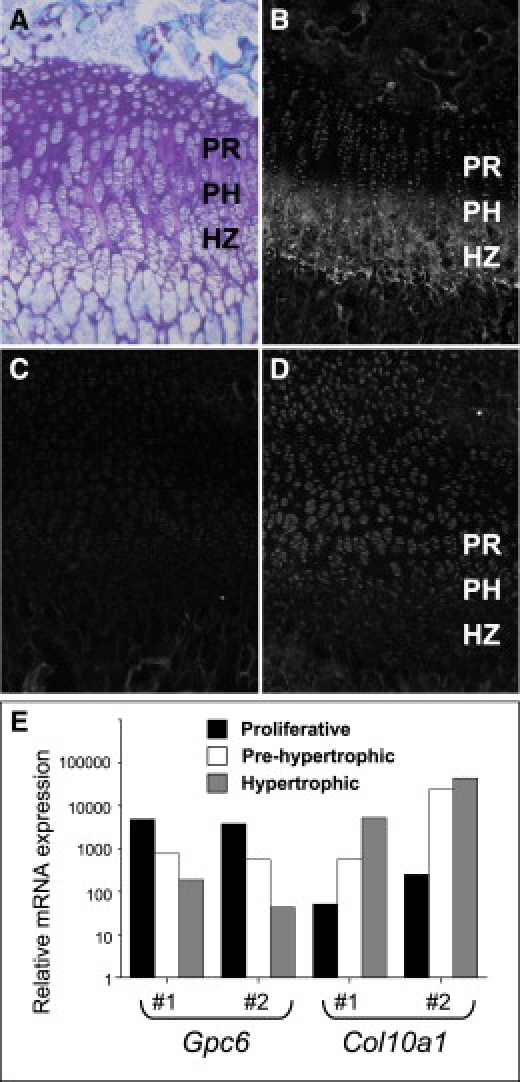
Glypicans are a family of glycosylphosphatidylinositol (GPI)-anchored, membrane-bound heparan sulfate (HS) proteoglycans. Their biological roles are only partly understood, although it is assumed that they modulate the activity of HS-binding growth factors. The involvement of glypicans in developmental morphogenesis and growth regulation has been highlighted by Drosophila mutants and by a human overgrowth syndrome with multiple malformations caused by glypican 3 mutations (Simpson-Golabi-Behmel syndrome). We now report that autosomal-recessive omodysplasia, a genetic condition characterized by short-limbed short stature, craniofacial dysmorphism, and variable developmental delay, maps to chromosome 13 (13q31.1-q32.2) and is caused by point mutations or by larger genomic rearrangements in glypican 6 (GPC6). All mutations cause truncation of the GPC6 protein and abolish both the HS-binding site and the GPI-bearing membrane-associated domain, and thus loss of function is predicted. Expression studies in microdissected mouse growth plate revealed expression of Gpc6 in proliferative chondrocytes. Thus, GPC6 seems to have a previously unsuspected role in endochondral ossification and skeletal growth, and its functional abrogation results in a short-limb phenotype.


Figures

Figure 1
Figure 1
Pedigrees and Haplotypes on Chromosome 13 of the Five Omodysplasia Families In squares: regions compatible with linkage in single families. In gray: common region of homozygosity in affected individuals of consanguineous families.
Figure 2
Figure 2
Clinical and Radiographic Features of Omodysplasia (A and B) Radiographic features of female patient 4, age 16 months. Note shortened femora and humeri with mild tapering and distally flared metaphyses; the tibiae are also short but are less affected. Note also the radioulnar diastasis and relative preservation of the acral skeletal elements. (C–E) Radiographic features of female patient 9, age 5 years. Note markedly short, “club shaped” humeri; shortened femora; radioulnar diastasis; and relative acral preservation. (F and G) Clinical features of patient 9 at birth (F) and age 1 year (G). Note posteriorly rotated ears, mild micrognathia, persistent capillary hemangioma, and marked rhizomesomelic limb shortening.
Figure 3
Figure 3
GPC6 Mutations Detected with Different Methods in Families 2, 3, 4, and 5 and in Patient 9 (A) aCGH results of patients 3, 4, 7, and 9 (homozygous deletions) and patient 5 (heterozygous duplication). (B) QMPSF results for one proband and parents of families 2, 3, 4, and 5 (data of other siblings are not shown) and of patient 9. The peaks obtained for the different exons in control DNA appear in blue, whereas peaks amplified from patients' and parents' DNA appear in green (families 2, 3, and 5 and patient 9) or red (family 4). In family 2, the peak of exon 4 (E4) shows a 2-fold intensity reduction in the parents compared to the control (heterozygous deletion), and it is absent in the proband (homozygous deletion). In family 3, the peaks corresponding to exons 5 and 6 (E5 and E6) show a 2-fold intensity reduction in the parents compared to the control (heterozygous deletion) and are absent in the proband (homozygous deletion); the peak of a control exon is not shown for space reasons. In family 4, the peak of exon 4 (E4) shows a 2-fold intensity increase in the father and the proband (heterozygous duplication) and overlaps with the control in the mother. In family 5, the peak corresponding to exon 3 shows a 2-fold intensity reduction in the parents compared to the control (heterozygous deletion) and is absent in the proband (homozygous deletion). In patient 9, the peak of exon 3 (E3) is absent (homozygous deletion), whereas the peak of the control exon (E7) overlaps with the control peak. (C) Breakpoint sequencing results: in family 2, IVS3 and IVS4 are truncated by a genomic deletion encompassing exon 4; 19 bp are inserted in the breakpoint between the two intronic sequences. In family 3, IVS4 and IVS6 are truncated by a genomic deletion encompassing exons 5 and 6; 3 bp are inserted in the breakpoint between the two intronic sequences. In family 5, IVS2 and IVS3 are truncated by a genomic deletion encompassing exon 3; 9 bp are inserted in the breakpoint between the two intronic sequences. In patient 9, IVS2 and IVS3 are truncated by a genomic deletion encompassing exon 3. Primers and genomic location of the amplicons shown here are reported in Table S4. In family 4, the borders of the genomic duplication were mapped by QMPSF: fragments IVS3-A and IVS4-D are located 5′ and 3′ of the duplication, respectively; IVS3-B and IVS4-C present enhanced amplification, indicating that at least one primer is located within the rearrangement (see also Table S4). (D) cDNA sequencing results: exon 4 is missing in family 2; exons 5 and 6 are missing in family 3; exon 4 occurs twice in family 4.
Figure 4
Figure 4
Summary of GPC6 Mutations Found in the Studied Patients with Respect to the Gene and Protein Structure (A) Genomic and protein structure of GPC6 gene. The proposed protein domains are shared by all glypicans. SP—signal peptide; CRD—cysteine-rich domain; GAG—heparan-sulfate (HS) glycosylation site; GPI—glycophosphatidyl-inositol binding site, which anchors glypican to the plasma membrane. (B) Schematic representation of genomic mutations found in omodysplasia patients.
Figure 5
Figure 5
Analysis of GPC6 Protein and mRNA in the Mouse Growth Plate (A) Toluidine-blue-stained section of growth-plate cartilage from a 2-week-old mouse, showing the organization of the chondrocytes in the proliferative (PR), pre-hypertrophic (PH), and hypertrophic zones (HZ). Immunostaining shows localization of collagen X (B) to the PH and HZ and a gradient of glypican 6 expression (D) from the PR and PH zones to little or no expression in the HZ. (C) Non-immune serum control. (E) Quantitative RT-PCR assay of the mRNA expression levels of Gpc6 and Col10a1 in microdissected cartilage zones from two biological replicates (#1 and #2). Gpc6 and Col10a1 expression was normalized to Atp5b mRNA by a comparative CT method.

Similar articles

Cited by

References

    1. Kirkpatrick C.A., Knox S.M., Staatz W.D., Fox B., Lercher D.M., Selleck S.B. The function of a Drosophila glypican does not depend entirely on heparan sulfate modification. Dev. Biol. 2006;300:570–582. - PubMed
    1. Filmus J. Glypicans in growth control and cancer. Glycobiology. 2001;11:19R–23R. - PubMed
    1. Nakato H., Kimata K. Heparan sulfate fine structure and specificity of proteoglycan functions. Biochim. Biophys. Acta. 2002;1573:312–318. - PubMed
    1. Filmus J., Selleck S.B. Glypicans: proteoglycans with a surprise. J. Clin. Invest. 2001;108:497–501. - PMC - PubMed
    1. Filmus J. The contribution of in vivo manipulation of gene expression to the understanding of the function of glypicans. Glycoconj. J. 2002;19:319–323. - PubMed

Publication types