. 2009 Jul;37(13):4518-31.
doi: 10.1093/nar/gkp441. Epub 2009 May 29.

Increasing the relative expression of endogenous non-coding Steroid Receptor RNA Activator (SRA) in human breast cancer cells using modified oligonucleotides

Affiliations

Increasing the relative expression of endogenous non-coding Steroid Receptor RNA Activator (SRA) in human breast cancer cells using modified oligonucleotides

Charlton Cooper et al. Nucleic Acids Res. 2009 Jul.

Abstract

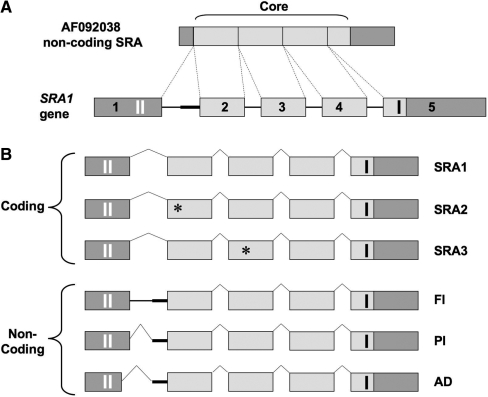
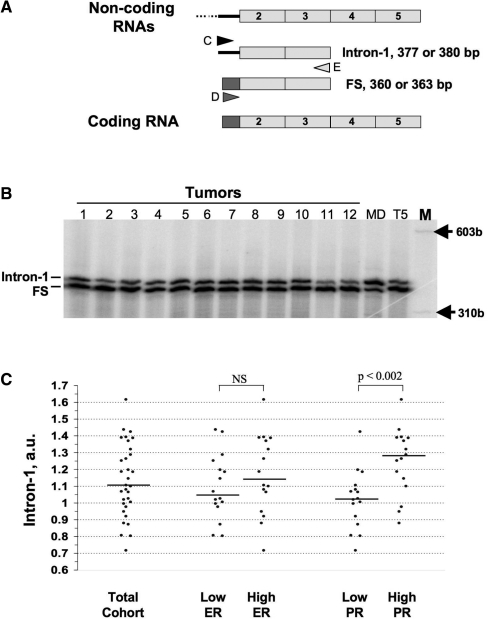
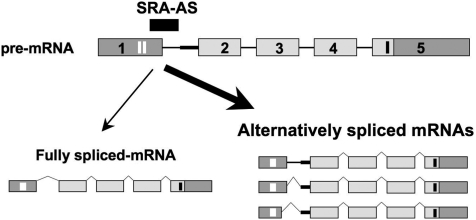
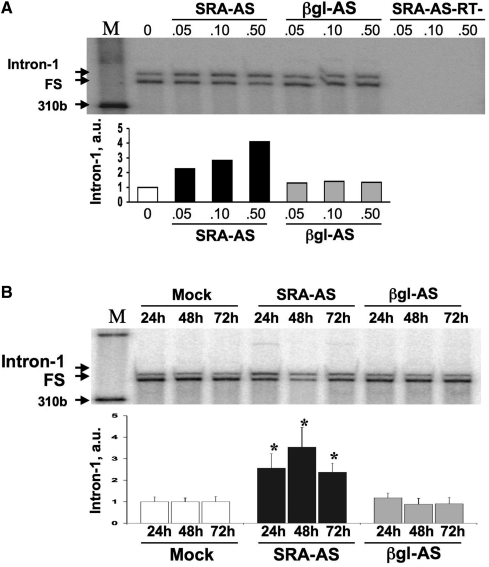
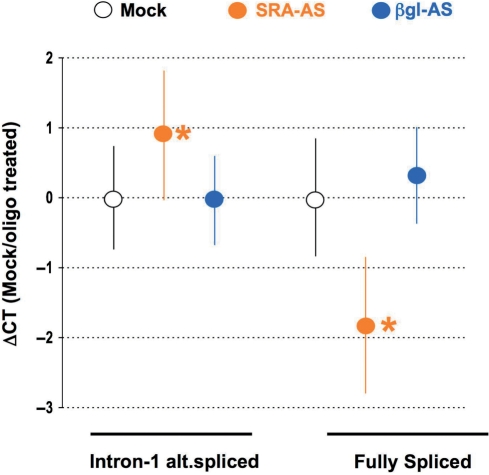
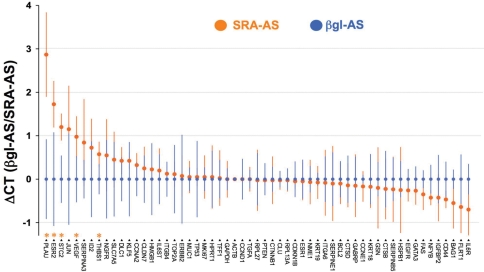
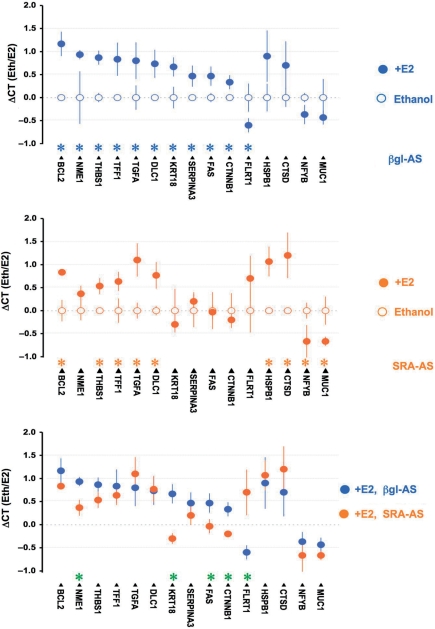
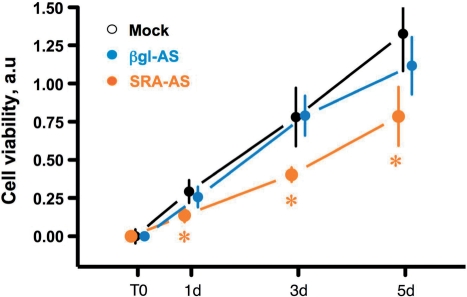
Products of the Steroid Receptor RNA Activator gene (SRA1) have the unusual property to modulate the activity of steroid receptors and other transcription factors both at the RNA (SRA) and the protein (SRAP) level. Balance between these two genetically linked entities is controlled by alternative splicing of intron-1, whose retention alters SRAP reading frame. We have previously found that both fully-spliced SRAP-coding and intron-1-containing non-coding SRA RNAs co-exist in breast cancer cell lines. Herein, we report a significant (Student's t-test, P < 0.003) higher SRA-intron-1 relative expression in breast tumors with higher progesterone receptor contents. Using an antisense oligoribonucleotide, we have successfully reprogrammed endogenous SRA splicing and increased SRA RNA-intron-1 relative level in T5 breast cancer cells. This increase is paralleled by significant changes in the expression of genes such as plasminogen urokinase activator and estrogen receptor beta. Estrogen regulation of other genes, including the anti-metastatic NME1 gene, is also altered. Overall, our results suggest that the balance coding/non-coding SRA transcripts not only characterizes particular tumor phenotypes but might also, through regulating the expression of specific genes, be involved in breast tumorigenesis and tumor progression.


Figures

Figure 1.
Figure 1.
Genomic structure of SRA1, coding and non-coding SRA transcripts. (A) SRA1 gene, located on chromosome 5q31.3, consists of five exons (boxes) and four introns (plain lines). The originally described non-coding SRA sequence (AF092038) contains a core sequence (light gray), necessary and sufficient for SRA RNAs to act as co-activators. (B) Three coding isoforms have been identified (SRA1, SRA2, SRA3), which contain an extended 5′-extremity containing two AUG initiating codons (vertical white bars in exon 1). The stop codon of the resulting open reading frames (236/237 aa) is depicted by a black vertical bar in exon 5. Black stars in exons 2 and 3 correspond to a point mutation (position 98 of the core: U to C) and a point mutation followed by a full codon (position 271 of the core: G changed to CGAC), respectively (5). Three non-coding SRA isoforms containing a differentially-spliced intron-1 have been characterized FI, full intron-1 retention; PI, partial intron-1 retention; AD, alternative 5′ donor and partial intron retention (12). Thick straight line, 60 bp of intron 1 retained in PI.
Figure 2.
Figure 2.
TP-PCR amplification of coding and non-coding SRA mRNAs in breast cancers. (A) Principle: three primers are used during the PCR amplification. The lower primer (E) is common to the two sequences whereas, the upper D and C primers are specific for exon-1 (gray) and intron-1 (black), respectively (12). Triple-primer PCR will lead to an intron-1 or Fully spliced (FS) products, corresponding to non-coding and coding SRA RNAs, respectively. (B) RNA from frozen tissue sections (1–12) and from T5 as well as MDA-MB-468 (MD) cells was reverse transcribed and amplified by TP-PCR as described in ‘Materials and Methods’ section. radio-labeled PCR products, run on an acrylamide gel, are visualized using a Biorad Phosphorimager. (C) Signals from three experiments have been quantified and the average relative proportion of non-coding SRA RNA expressed in arbitrary unit (intron-1 a.u) as detailed in the ‘Materials and Methods’ section has been graphed for each tumor. For analysis purposes, tumors have been grouped according to their ER levels: lower and higher than the median; or according to their PR levels: lower and higher than the median. The horizontal bar indicates the median of intron-1 values for each subgroup. Differences have been tested using the Student's t-test two-tailed.
Figure 3.
Figure 3.
Principle: an oligonucleotide complementary to the junction exon-1/intron-1 is designed to interfere with the proper splicing of SRA pre-messenger. As a result, a higher proportion of alternatively spliced transcripts (containing Full—FI- or partial—PI-intron-1 retention, or resulting from the use of an alternative donor site (AD) as defined Figure 1) relative to the fully spliced (FS) should be observed.
Figure 4.
Figure 4.
Dose and time dependence analysis. (A) T5 cells were treated with increasing amounts (0, 0.05, 0.1, 0.5 μM) of SRA-AS or control oligos (βgl-AS). At t: 24 h, total RNA was extracted, reverse-transcribed and amplified by TP-PCR as described in ‘Material and methods’ section. Samples were separated on PAGE gel and visualized using a Molecular ImagerTM-FX. SRA-AS-RT- correspond to RNAs from SRA-AS amplified without reverse-transcription. Signals corresponding to intron-1 and FS were quantified and the proportion of intron-1 retention expressed in arbitrary unit (a.u) as described in ‘Materials and Methods’ section. (B) T5 cells were treated with no oligonucleotide (Mock), 0.5 μM of SRA–AS or 0.5 μM βgl–AS. At t: 24, 48 and 72 h, total RNA was extracted, reverse-transcribed and amplified by TP-PCR as described in ‘Material and methods’ section. Samples were separated on PAGE gel and visualized using a Molecular ImagerTM-FX. Signals corresponding to intron-1 and FS were quantified and the proportion of intron-1 retention expressed in arbitrary unit (a.u) as described in ‘Materials and Methods’ section. Bars represent the average value of five independent experiments normalized to values obtained for mock transfection at a given time point. Error bars represent standard deviation. *Correspond to P-values lower than 0.05 (Student's t-test).
Figure 5.
Figure 5.
Real-time PCR quantification of intron-1 retaining and fully spliced SRA RNAs expression following treatment of T5 cells. T5 cells were treated with no oligoribonucleotide (Mock, white circle), 0.5 μM of SRA–AS (orange circle) or 0.5 μM βgl–AS (blue circle). At t: 24 h, total RNA was extracted, reverse-transcribed and analyzed by real-time PCR as described in ‘Material and methods’ section. Three experiments were performed and for each treatment, ΔCt has been calculated as described in the ‘Materials and Methods’ section. Dots represent the average ΔCt for each treatment whereas bars correspond to standard deviations. Asterisk indicate a significant difference (Student's t-test, two-sided) in the corresponding SRA (intron-1 alternatively spliced or fully spliced) expression between mock and oligo-transfected cells.
Figure 6.
Figure 6.
Western blot analysis of SRAP in T5 cells treated with 0.5 μM SRA–AS. T5 cells were treated with 0.5 μM of SRA–AS or 0.5 μM βgl–AS. At t: 24, 48 and 72 h, total were extracted and analyzed by Western using anti-SRAP antibodies as described in ‘Materials and Methods’ section. This Figure is representative of results obtained from three independent experiments.
Figure 7.
Figure 7.
Change in gene expression in T5 cells following SRA–AS treatment. T5 cells were treated with 0.5 μM of SRA–AS or 0.5 μM βgl–AS as described above. At t: 24 h, RNA was extracted, reverse-transcribed, and used to assess, by real-time PCR, the expression of a series of 57 genes historically linked to breast cancer, as described in the ‘Materials and Methods’ section. Four independent experiments were performed. Blue dots represent, for each gene, the normalized expression upon βgl–AS treatment. Orange dots represent the average ΔCT increase or decrease in gene expression upon SRA–AS treatment. Bars represent the standard deviation for each gene and treatment. Genes whose expression is significantly modified (P < 0.05, Student's t-test, two-sided) upon SRA–AS treatment are indicated by orange stars.
Figure 8.
Figure 8.
Differential estrogen regulation of gene expression in T5 cells following SRA–AS treatment. T5 cells were treated with 0.5 μM of βgl–AS or 0.5 μM SRA–AS as described earlier. Forty hours later, cells were treated for 4 h by E2 10−8M or vehicle (ethanol) alone, RNA was extracted, reverse-transcribed, and assessed for the expression of a series of 57 genes as described in the ‘Materials and Methods’ section. Three independent experiments were performed, and the expression of each gene normalized as detailed in the ‘Materials and Methods’ section. The average expression of 15 genes upon E2 treatment (filled circle) and ethanol (hollow circle) are depicted. Bars represent standard deviation. (A) Cells have been treated with 0.5 μM βgl–AS. Genes expression of which is significantly (p < 0.05, Student's t-test, two- sided) different between E2 treatment and Ethanol, are indicated by blue stars. (B) Cells have been treated with 0.5 μM SRA–AS. Genes expression of which is significantly (P < 0.05, Student's t-test, two-sided) different between E2 treatment and Ethanol are indicated by orange stars. (C) To visualize the differential effect of E2 in cells treated with SRA–AS (orange) and βgl–AS (blue), E2 corresponding dots from A and B have been plotted on the same graph. Genes whose expression is significantly (P < 0.05, Student's t-test, two-sided) different upon E2 treatment are indicated by green stars.
Figure 9.
Figure 9.
Differential viability of T5 cells following SRA–AS treatment. Cells were treated with SRA–AS (orange), βgl–AS (blue) or without (Mock, Black) oligonucleotides, re-seeded in 96 wells plates after 24 h and allowed to grow in normal medium for an additional 24 h. At this time (T0), or 1 (1d), 3 (3d) and 5 (5d) days later, the amount of live cells was determined and expressed in arbitrary unit as described in the ‘Materials and Methods’ section. For each point, the mean and the standard deviation corresponding to two independent experiments, each performed in quadruplicate, are indicated. Stars indicate a significant (P < 0.05) difference between SRA–AS and both negative controls (βgl–AS and Mock), as assessed by the Student's t-test, two-tailed.

References

    1. Lanz RB, McKenna NJ, Onate SA, Albrecht U, Wong J, Tsai SY, Tsai MJ, O'Malley BW. A steroid receptor coactivator, SRA, functions as an RNA and is present in an SRC-1 complex. Cell. 1999;97:17–27. - PubMed
    1. Leygue E. Steroid receptor RNA activator (SRA1): unusual bi-faceted gene products with suspected relevance to breast cancer. Nuclear Recep. Signal. 2007;5:e006. - PMC - PubMed
    1. Shi YH, Downes M, Xie W, Kao HY, Ordentlich P, Tsai CC, Hon M, Evans RM. Sharp, an inducible cofactor that integrates nuclear receptor repression and activation. Genes Dev. 2001;15:1140–1151. - PMC - PubMed
    1. Hatchell EC, Colley SM, Beveridge DJ, Epis MR, Stuart LM, Giles KM, Redfern AD, Miles LEC, Barker A, MacDonald LM, et al. SLIRP, a small SRA binding protein, is a nuclear receptor corepressor. Mol. Cell. 2006;22:657–668. - PubMed
    1. Emberley E, Huang GJ, Hamedani MK, Czosnek A, Ali D, Grolla A, Lu B, Watson PH, Murphy LC, Leygue E. Identification of new human coding steroid receptor RNA activator isoforms. Biochem. Biophys. Res. Commun. 2003;301:509–515. - PubMed

Publication types