. 2009 Jul;12(7):932-8.
doi: 10.1038/nn.2324. Epub 2009 May 31.

Odor quality coding and categorization in human posterior piriform cortex

Affiliations

Odor quality coding and categorization in human posterior piriform cortex

James D Howard et al. Nat Neurosci. 2009 Jul.

Abstract

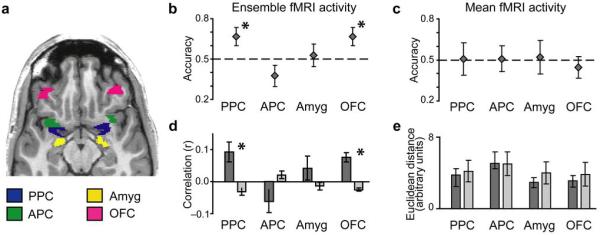
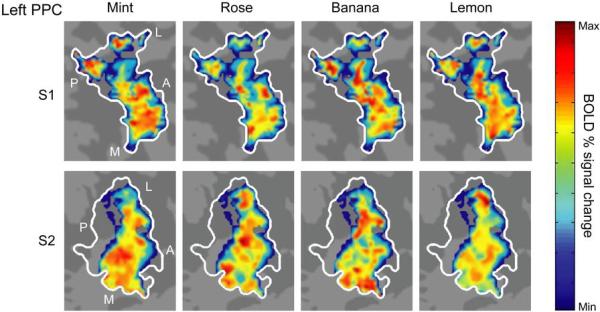
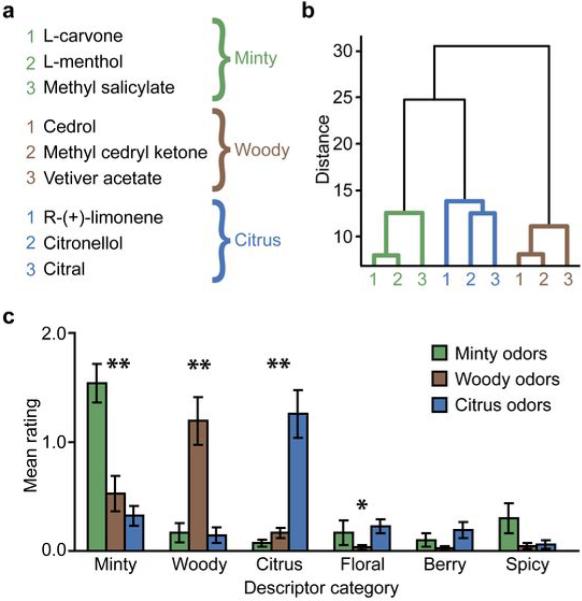
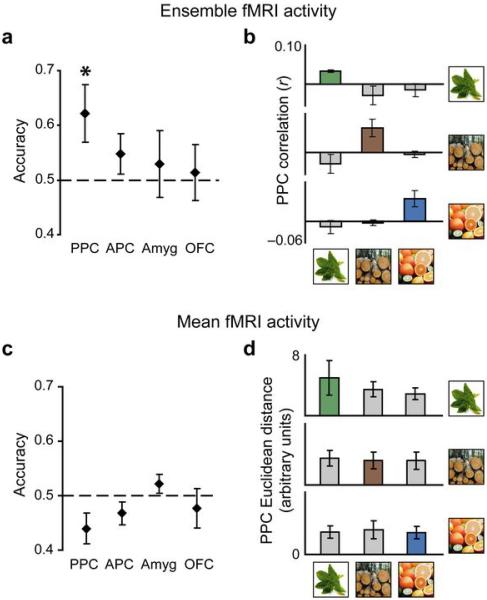
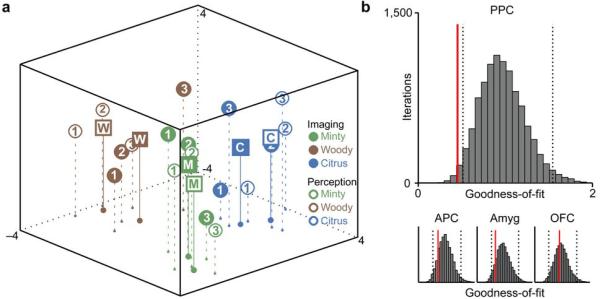
Efficient recognition of odorous objects universally shapes animal behavior and is crucial for survival. To distinguish kin from nonkin, mate from nonmate and food from nonfood, organisms must be able to create meaningful perceptual representations of odor qualities and categories. It is currently unknown where and in what form the brain encodes information about odor quality. By combining functional magnetic resonance imaging (fMRI) with multivariate (pattern-based) techniques, we found that spatially distributed ensemble activity in human posterior piriform cortex (PPC) coincides with perceptual ratings of odor quality, such that odorants with more (or less) similar fMRI patterns were perceived as more (or less) alike. We did not observe these effects in anterior piriform cortex, amygdala or orbitofrontal cortex, indicating that ensemble coding of odor categorical perception is regionally specific for PPC. These findings substantiate theoretical models emphasizing the importance of distributed piriform templates for the perceptual reconstruction of odor object quality.


Figures

Fig. 1
Fig. 1
Schematic diagram of the correlation analysis. (a) The condition-specific spatial patterns of voxel activity in the PPC were transformed into linear vectors of voxel activity (pattern vectors). Voxels are represented by shaded squares on an axial slice of an anatomical MRI scan. The level of grey-scale intensity represents the blood oxygen level-dependent (BOLD) signal intensity. (b) Pattern vectors were composed of the peak BOLD activity across the stimulus presentation, shown here in the context of Experiment 1, for one run (150 s). (c) The entire dataset of pattern vectors was split into halves, one containing data from the 12 even runs and one from the 12 odd runs, and then averaged across runs, producing one mean pattern vector per odorant in each half of the data. (d) Averaged pattern vectors were used to calculate within-odorant (orange arrow) and across-odorant (blue arrow) pairwise correlation coefficients.
Fig. 2
Fig. 2
Behavioral data and univariate imaging analysis for Experiment 1. (a) Group-averaged behavioral ratings of odor intensity, pleasantness, pungency, and familiarity are depicted as boxplots indicating median (central line) and upper and lower quartiles (top and bottom of box, respectively) for each odorant. Whiskers denote extent of data between 10th and 90th percentiles. Outliers are indicated by crosses. Ratings did not significantly differ across any of these measures. (b) Mean normalized values (± between-subjects s.e.m.) for sniff peak amplitude, duration, and inspiratory volume (insp. vol.) did not significantly differ between the four odorants. (c) Plots of mean fMRI signal in PPC for each subject and odorant (± within-subject s.e.m.) revealed no significant difference except for subject 5 (S5).
Fig. 3
Fig. 3
Pattern discrimination of odor quality in human PPC and OFC. (a) Axial slice of a T1-weighted structural scan showing anatomically defined regions of interest. Subsets of voxels from these brain regions (see Methods) were used in the pattern analyses. (b) Odor identification accuracy (mean ± between-subjects s.e.m; N = 6) calculated using fMRI patterns of ensemble activity exceeded chance (dashed line) across subjects in PPC and OFC, and the within-odor correlations (dark-grey bars) were greater than the across-odor correlations (light-grey bars) in both regions (d). In contrast, identification accuracy based on mean fMRI activity levels did not significantly differ from chance in any of the measured regions (c), nor were there significant differences between within-odor and across-odor Euclidean distances (e). *, P < 0.05.
Fig. 4
Fig. 4
Odorant-specific spatial maps in PPC. The three-dimensional representations of odorant-evoked activity in PPC from two subjects were projected onto two-dimensional (flat) maps, allowing visualization of voxel-wise odor patterns within a single plane. Maps depict the odorant-evoked BOLD percent signal change in all odor-active voxels (liberally thresholded at P < 0.5), averaged across trials for each of the four odorants. The pseudocolor scale spans the full range of BOLD percent signal change within each map, from minimum (deep blue) to maximum (bright red). Each odorant elicited a distributed pattern of fMRI activity within left PPC (white outline) that overlapped with, but was distinct from, the other odorants. Unique distributed, overlapping profiles were also observed in right PPC (not shown). A, anterior; L, lateral; M; medial; P, posterior.
Fig. 5
Fig. 5
Odor stimuli and psychophysical ratings for Experiment 2. (a) The nine odorants included three stimuli per each of three quality categories (minty, woody, and citrus). (b) A dendrogram plot obtained from cluster analysis of the mean pairwise similarity ratings of odor quality revealed that the nine odorants sorted into three quality categories. Shorter distances indicate greater similarity. (c) Ratings of the applicability of 146 odor descriptors to the odor stimuli (descriptors pre-sorted into six different quality categories) indicated that subjects classifed the odorants into the appropriate categories (mean ± between-subjects s.e.m; N = 10). Non-parametric Friedman tests for related samples were separately conducted on each category (*, P < 0.05; **, P < 0.005).
Fig. 6
Fig. 6
fMRI pattern discrimination of odor categorical perception in PPC. (a, b) Classification performance calculated using fMRI patterns of ensemble activity. (a) Odor identification accuracy (mean ± between-subjects s.e.m; N = 4) was significantly greater than chance in PPC only. *, P < 0.05. (b) The within-category correlation was greater than the across-category correlation in PPC for all three odor quality categories, an effect that was separately observed for each category. (c, d) Classification performance calculated using fMRI mean activity. (c) Identification accuracy did not significantly differ from chance in any of the four regions, and there was no significant group difference between within-category and across-category Euclidean distances in PPC (d), or in APC, amygdala, or OFC (data not shown).
Fig. 7
Fig. 7
Alignment of fMRI spatial patterns and perceived odor quality. (a) The group-averaged imaging and perceptual data-sets were each projected onto a common three-dimensional space using multidimensional scaling (MDS), revealing that the imaging maps of PPC linear correlations (filled circles) closely overlapped with the perceptual maps of odor quality similarity (empty circles), both for individual odorants and for odor quality categories. Squares labelled “M” (minty), “W” (woody), and “C” (citrus) represent centroids of each category for the imaging (solid squares) and perceptual (empty squares) data. (b) The observed goodness-of-fit in PPC (red line) fell outside the lower bound of the 95% confidence interval (dashed lines) of a randomly permuted distribution of goodness-of-fits, demonstrating a significant alignment between PPC activity and perception in this region. Alignment between imaging and perception was not significant in APC, amygdala, or OFC.

Comment in

  • A noseful of objects.
    Margot C. Margot C. Nat Neurosci. 2009 Jul;12(7):813-4. doi: 10.1038/nn0709-813. Nat Neurosci. 2009. PMID: 19554043 No abstract available.

References

    1. Rosch EH. Principles of categorization. In: Rosch EH, Lloyd B, editors. Cognition and Categorization. Erlbaum Associates; Hillsdale: 1978. pp. 27–48.
    1. Miller EK, Nieder A, Freedman DJ, Wallis JD. Neural correlates of categories and concepts. Curr. Opin. Neurobiol. 2003;13:198–203. - PubMed
    1. Reddy L, Kanwisher N. Coding of visual objects in the ventral stream. Curr. Opin. Neurobiol. 2006;16:408–414. - PubMed
    1. Kendrick KM, et al. Neural control of maternal behaviour and olfactory recognition of offspring. Brain Res. Bull. 1997;44:383–395. - PubMed
    1. Todrank J, Heth G, Johnston RE. Kin recognition in golden hamsters: evidence for kinship odours. Anim. Behav. 1998;55:377–386. - PubMed

Publication types