. 2009 Jul;10(7):769-77.
doi: 10.1038/ni.1743. Epub 2009 May 31.

The receptor S1P1 overrides regulatory T cell-mediated immune suppression through Akt-mTOR

Affiliations

The receptor S1P1 overrides regulatory T cell-mediated immune suppression through Akt-mTOR

Guangwei Liu et al. Nat Immunol. 2009 Jul.

Abstract

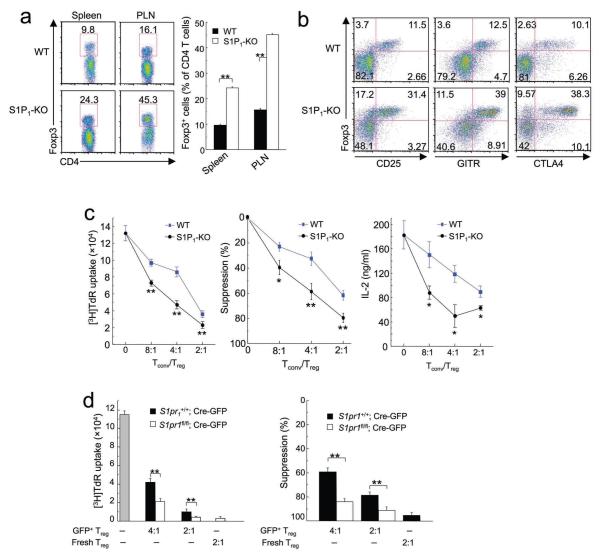
Regulatory T cells (T(reg) cells) are critically involved in maintaining immunological tolerance, but this potent suppression must be 'quenched' to allow the generation of adaptive immune responses. Here we report that sphingosine 1-phosphate (S1P) receptor type 1 (S1P1) delivers an intrinsic negative signal to restrain the thymic generation, peripheral maintenance and suppressive activity of T(reg) cells. Combining loss- and gain-of-function genetic approaches, we found that S1P1 blocked the differentiation of thymic T(reg) precursors and function of mature T(reg) cells and affected T(reg) cell-mediated immune tolerance. S1P1 induced selective activation of the Akt-mTOR kinase pathway to impede the development and function of T(reg) cells. Dynamic regulation of S1P1 contributed to lymphocyte priming and immune homeostasis. Thus, by antagonizing T(reg) cell-mediated immune suppression, the lipid-activated S1P1-Akt-mTOR pathway orchestrates adaptive immune responses.


Figures

Figure 1
Figure 1. S1P1 negatively regulates thymic Foxp3+ Treg population
(a,b) Flow cytometry of total and gated CD4SP thymocytes isolated from wild-type (WT) control, S1P1-KO (a) and S1P1-Tg mice (b). Panels on the right show the proportions and absolute numbers of Foxp3+ CD4SP Treg cells. Data are the mean (+s.d.) of 8-14 mice of each genotype from 7 experiments. (c) Foxp3 expression in bone marrow chimeras following retroviral transduction of S1P1. Bone marrow stem cells from WT mice were transduced with retrovirus expressing S1P1 (S1P1-GFP) or empty vector (GFP), and transferred into sublethally irradiated Rag1-/- mice. At 6-8 weeks after reconstitution, Foxp3 expression was analyzed in gated CD4SP thymocytes. Data are representative of 2 independent experiments. (d) Expression of Foxp3 in mixed bone marrow chimeras. Bone marrow stem cells from WT (CD45.1+) and S1P1-KO or S1P1-Tg mice (CD45.2+) were mixed at 1:1, and transferred into Rag1-/- mice to generate mixed bone marrow chimeras. At 6-8 weeks after reconstitution, Foxp3 expression was analyzed in CD4SP thymocytes, and cells from different donors were distinguished by their CD45.1 and CD45.2 expression. Data are representative of 3 independent experiments. *, P < 0.001 (Student’s t-test).
Figure 2
Figure 2. S1P1 blocks thymic differentiation of Treg cells
(a) Flow cytometry of total and gated CD4SP thymocytes isolated from WT control, S1P1-KO and S1P1-Tg FTOC. Panels on the right show the proportions and absolute numbers of Foxp3+ CD4SP Treg cells with the mean (+s.d.) calculated from ≥8 mice of each genotype. (b) Flow cytometry of gated CD4SP thymocytes from WT control, S1P1-KO and S1P1-Tg mice. Panels on the right show the proportions and absolute numbers of the CD4+CD25+Foxp3 precursor population, with the mean (+s.d.) calculated from ≥8 mice of each genotype. (c) Induction of Foxp3 expression in the CD4+CD25+Foxp3 population in vitro. CD4+CD25+Foxp3 cells were purified and stimulated with medium alone, IL-2 or IL-15 for 20 h, and induction of Foxp3 expression was measured by flow cytometry. The lower panel shows an IL-2 dependent dose response curve. Data are representative of 5 independent experiments. *, P < 0.05; **, P < 0.01 (Student’s t-test).
Figure 3
Figure 3. Enhanced peripheral population and suppressive activity of S1P1-KO Treg cells
(a) Flow cytometry of gated CD4 T cells from the spleen and peripheral lymph nodes (PLN) of WT and S1P1-KO mice. The panel on the right shows the proportions of Foxp3+ Treg cells among total CD4+ T cell population, with the mean (+s.d.) calculated from 4 mice of each genotype. (b) Flow cytometry analysis of Treg markers (Foxp3, CD25, GITR and CTLA4) in PLN of WT and S1P1-KO mice. Data are representative of 2 independent experiments. Similar findings were observed in other peripheral lymphoid organs (not shown). (c) In vitro T-cell suppression assays using Foxp3+ CD4SP cells from WT and S1P1-KO mice. The left panel shows a representative proliferative assay of 4 independent experiments, the middle panel is the percentage of suppression with the mean (±s.d.) calculated from 4 experiments, and the right panel shows a representative of 2 independent experiments measuring IL-2 production. (d) In vitro T-cell suppression assays using S1P1-deleted peripheral Treg cells. Foxp3+ Treg cells from the periphery of S1pr1+/+ and S1pr1fl/fl mice were transduced with Cre-expressing retrovirus (Cre-GFP), and sorted GFP+ Treg cells were used in the T-cell suppression assays with different Tconv and Treg ratios; freshly isolated Treg cells were used as a comparison. The left panel is a representative of 3 independent experiments, and the right panel shows the percentage of suppression with the mean (+s.d.) calculated from 3 experiments. *, P < 0.01; **, P < 0.001 (Student’s t-test).
Figure 4
Figure 4. Reduced suppressive activity of S1P1-Tg Treg cells in vitro and in vivo
(a) In vitro T-cell suppression assays using Foxp3+ Treg cells from WT and S1P1-Tg mice. The left panel shows a representative proliferative assay of 8 independent experiments, and the right panel is the percentage of suppression with the mean (±s.d.) calculated from 8 experiments. (b) In vitro T-cell suppression assays using Foxp3+ Treg cells transduced with S1P1-expressing retrovirus. WT Treg cells were transduced with S1P1-expressing (S1P1-GFP) and empty vector (GFP) retroviruses, and sorted GFP+ Treg cells were used in the T-cell suppression assays with different Tconv and Treg ratios. The left panel shows a representative proliferative assay of 5 independent experiments, and the right panel is the percentage of suppression with the mean (+s.d.) calculated from 5 experiments. (c-e) Failure of S1P1-Tg Treg cells to control colitis in vivo. Tconv cells were transferred alone or in combination with WT or S1P1-Tg Treg cells into Rag1-/- mice. (c) Changes in body weight after transfer. (d) Histology scores of experimental mice. (e) Representative colon histology. Data are the mean (+s.d.) of 5 mice of each genotype and are representative of 2 independent experiments. *, P < 0.001 (Student’s t-test).
Figure 5
Figure 5. S1P1-Tg mice show disrupted immune homeostasis and develop age-related autoimmunity due to defects in the Treg compartment
(a-e) Analysis of WT and S1P1-Tg mice. (a) Flow cytometry of T cell activation markers from peripheral lymphoid organs of aged mice (10 months). MLN, mesenteric lymph nodes. Data are representative of 6 independent experiments. (b) Proliferative response to TCR stimulation of Tconv cells from WT and S1P1-Tg mice (2 months). Data are representative of 6 independent experiments. (c) Titers of anti-nuclear antigen and anti-ds DNA antibodies of aged mice (10 months). Data are the mean (±s.d.) of >10 mice of each genotype and are representative of 4 independent experiments. (d) Effector cytokine production of activated T cells from WT and S1P1-Tg mice (5-6 months). Data are representative of 2 independent experiments. (e) Serum titers of IgG1 and IgG2a (5-6 months). Data are the mean of 5 mice of each genotype and are representative of 3 independent experiments. (f-h) Analysis of WT and S1P1-Tg T cells in the mixed BM chimeras (6-9 months after reconstitution), including expression of activation markers (f), proliferation (g), and effector cytokine production (h). Data are representative of 3 independent experiments. *, P < 0.05; **, P < 0.01; ***, P < 0.001 (Student’s t-test).
Figure 6
Figure 6. S1P1 induces activation of Akt-mTOR to inhibit Treg development and function
(a) IL-2 activated signaling pathways in thymic Treg precursors from WT and S1P1-Tg mice. CD4+CD25+Foxp3 cells were purified and stimulated with medium alone or IL-2, and activation of Akt, STAT5, Erk and S6 ribosomal protein (S6) were examined by flow cytometry using phospho-specific antibodies. Data are representative of 4 independent experiments. (b) Effects of drug treatments on IL-2 induced Foxp3 expression in Treg precursors. CD4+CD25+Foxp3 cells were treated with U0126, LY294002 and Rapamycin for 30 minutes, followed by IL-2 stimulation. Data are representative of 3 independent experiments. (c) IL-2 activated signaling pathways in peripheral Treg cells from WT and S1P1-Tg mice. Treg cells were stimulated with medium alone or IL-2, and activation of Akt, STAT5, Erk and S6 ribosomal protein (S6) were examined by flow cytometry using phospho-specific antibodies. Data are representative of 5 independent experiments. (d) Suppressive activity of Treg cells transduced with dn-Akt retrovirus. WT and S1P1-Tg Treg cells were transduced with control (MiT) and dn-Akt expressing (dn-Akt) retroviruses (non-transduced cells are shown on the right as a comparison), and transduced cells were sorted and used in the T-cell suppression assays with different Tconv and Treg ratios. Data are representative of 3 independent experiments. *, P < 0.001 (Student’s t-test).
Figure 7
Figure 7. S1P1 is necessary for Akt activation in Treg cells
(a,b) IL-2 activated signaling pathways in thymic Treg precursors (a) and Foxp3+ reg Treg cells (b) from WT and S1P1-KO mice. Purified CD4+CD25+Foxp3 cells (a) or CD4+Foxp3+ cells (b) were stimulated with medium alone or IL-2, and activation of Akt, STAT5 and Erk were examined by flow cytometry using phospho-specific antibodies. Data are representative of 3 independent experiments. (c) Suppressive activity of Treg cells transduced with Cre-GFP retrovirus alone or in combination with constitutively active Akt. Foxp3+ Treg cells from the periphery of S1pr1+/+ and S1pr1fl/fl mice were transduced with Cre-expressing retrovirus (Cre-GFP) alone or in combination with empty control (MiT) or constitutively active Akt (ca-Akt) retroviruses, and transduced cells were sorted and used in the T-cell suppression assays with different Tconv and Treg ratios. Data are representative of 2 independent experiments. *, P < 0.001 (Student’s t-test).
Figure 8
Figure 8. Differential regulation of S1P1 expression in Treg and Tconv cells
(a) Treg and Tconv cells from WT mice were stimulated with anti-CD3, anti-CD28 and IL-2, and S1pr1 mRNA expression was analyzed by quantitative PCR. Data are representative of 3 independent experiments. (b) OT-II TCR-transgenic mice were crossed with Foxp3gfp knockin mice, and sorted Treg and Tconv cells from these mice were transferred into C57BL/6 mice, followed by s.c. immunization with ovalbumin emulsified in CFA. Two days after immunization, Treg and Tconv cells from the draining lymph nodes were purified based on GFP expression, and S1pr1 mRNA expression was analyzed in each T-cell subset. Data are representative of 2 independent experiments.

References

    1. Sakaguchi S, Yamaguchi T, Nomura T, Ono M. Regulatory T cells and immune tolerance. Cell. 2008;133:775–787. - PubMed
    1. Zheng Y, Rudensky AY. Foxp3 in control of the regulatory T cell lineage. Nat Immunol. 2007;8:457–462. - PubMed
    1. Campbell DJ, Ziegler SF. FOXP3 modifies the phenotypic and functional properties of regulatory T cells. Nat Rev Immunol. 2007;7:305–310. - PubMed
    1. Tang Q, Bluestone JA. The Foxp3+ regulatory T cell: a jack of all trades, master of regulation. Nat Immunol. 2008;9:239–244. - PMC - PubMed
    1. Shevach EM, et al. The lifestyle of naturally occurring CD4+ CD25+ Foxp3+ regulatory T cells. Immunol Rev. 2006;212:60–73. - PubMed

Publication types

MeSH terms

Substances