. 2009 Aug 6;28(31):2796-805.
doi: 10.1038/onc.2009.139. Epub 2009 Jun 1.

Anchorage-independent cell growth signature identifies tumors with metastatic potential

Affiliations

Anchorage-independent cell growth signature identifies tumors with metastatic potential

S Mori et al. Oncogene. .

Abstract

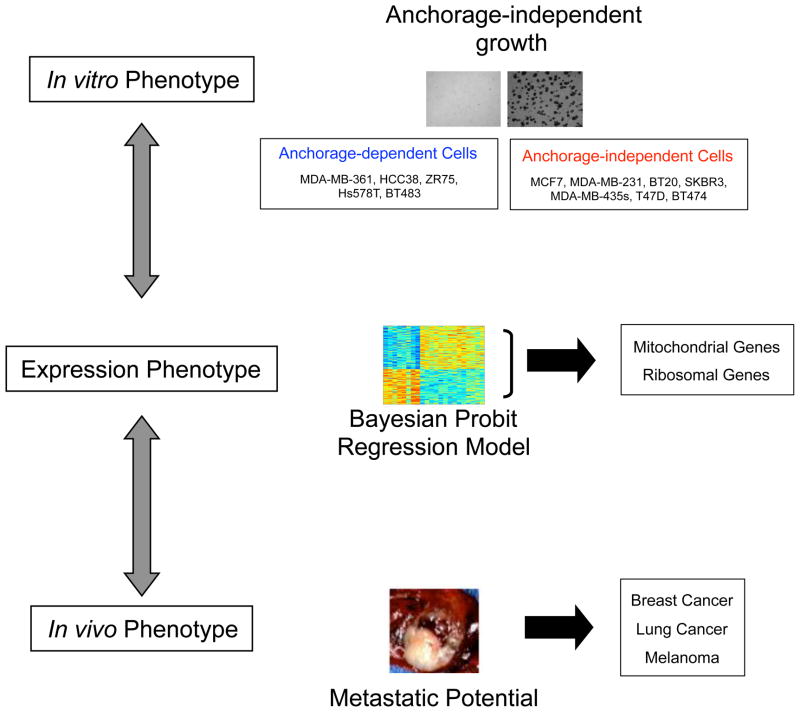
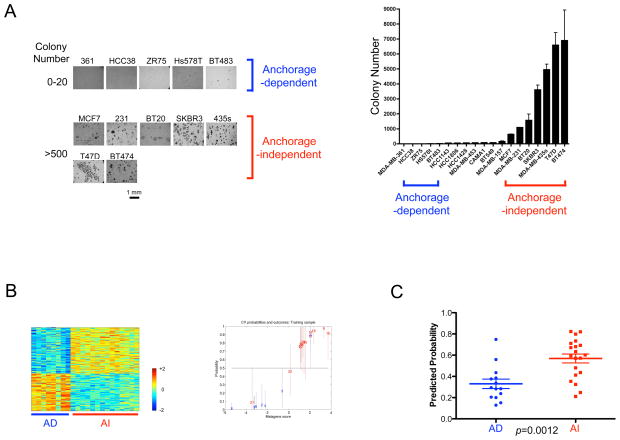
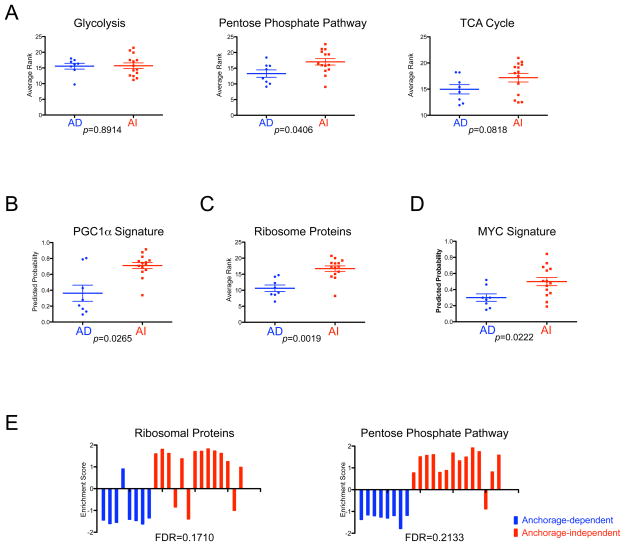
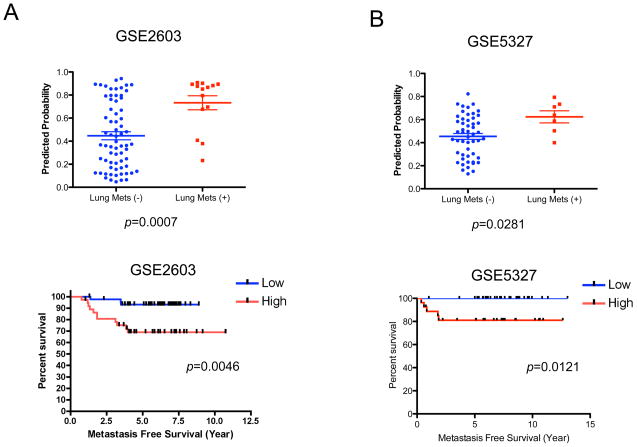
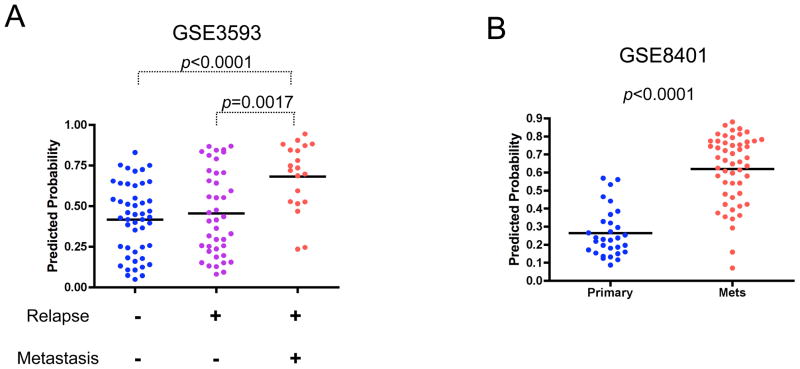
The oncogenic phenotype is complex, resulting from the accumulation of multiple somatic mutations that lead to the deregulation of growth regulatory and cell fate controlling activities and pathways. The ability to dissect this complexity, so as to reveal discrete aspects of the biology underlying the oncogenic phenotype, is critical to understanding the various mechanisms of disease as well as to reveal opportunities for novel therapeutic strategies. Previous work has characterized the process of anchorage-independent growth of cancer cells in vitro as a key aspect of the tumor phenotype, particularly with respect to metastatic potential. Nevertheless, it remains a major challenge to translate these cell biology findings into the context of human tumors. We previously used DNA microarray assays to develop expression signatures, which have the capacity to identify subtle distinctions in biological states and can be used to connect in vitro and in vivo states. Here we describe the development of a signature of anchorage-independent growth, show that the signature exhibits characteristics of deregulated mitochondrial function and then demonstrate that the signature identifies human tumors with the potential for metastasis.


Figures

Figure 1
Figure 1. Strategy to characterize an anchorage-independent growth in vitro phenotype in combination with in vivo phenotypes
To explore the relevance of the anchorage-independent phenotype for human cancer, we made use of a strategy to generate a signature for anchorage-independent growth capability from in vitro assays by a Bayesian probit regression model and then used the signature to assess the phenotype in a collection of human tumor samples.
Figure 2
Figure 2. Development of a gene expression signature representing anchorage-independent cell growth ability of cultured breast cancer cells
A. Colony forming ability of cultured breast cancer cells. Left panel: Morphological appearance of human breast cancer cell colonies grown in methylcellulose. Photographs by inverted microscopy are shown with cell line names and number of colonies. We designated cells that form fewer than 20 and more than 500 colonies after plating of 20,000 cells as anchorage-dependent and anchorage-independent, respectively. Right panel: Bar graph of colony numbers for 19 breast cancer cell lines. Error bars indicate standard deviations. B. A gene signature for anchorage-independent growth of breast cancer cells. Left panel: The expression pattern of genes that distinguish anchorage-independent cells (AI) from anchorage-dependent cells (AD). The expression pattern of a two hundred gene signature is shown as a heatmap (red=high and blue=low expression). Right panel: A leave-one-out cross validation of probabilities for anchorage-independent growth ability (blue=anchorage-dependent cells, red=anchorage-independent cells). The accuracy of this signature was 86.4% using 0.5 as a cutoff probability. Outliers in this leave-one-out cross validation analysis are Hs578T (#6; having AD phenotype but resembling AI cells transcriptionally) and BT474 (#21 and #22 from two different batches; having AI phenotype but resembling AD cells transcriptionally) C. Prediction of anchorage-independent growth ability of ovarian cells by the gene signature derived from breast cancer cells. Predicted probabilities are plotted for the categories with anchorage-dependent (AD) and anchorage-independent (AI) growth ability, and then are statistically evaluated using Mann-Whitney U test using GraphPad’s Prism. We use the same cut-off (AD<20 and AI>500 colonies) that is used to breast cancer cells. A bar indicates the mean value for each group.
Figure 3
Figure 3. Characterization of the anchorage-independent growth expression signatures
A. Comparison of the patterns of gene sets that reflect glucose metabolism between breast cancer cells with anchorage-dependent (AD<20 colonies) and anchorage-independent (AI>500 colonies) growth ability. Based on the gene list in previous work (Funes et al., 2007), we make the average rank of the gene sets for glucose metabolism pathways to estimate the activity of the pathway. Relative expression in the form of average rank is plotted and compared between breast cancer cells with AD and AI growth ability by Mann-Whitney U test using GraphPad’s Prism. A bar indicates the mean value for each group. B. Prediction of the peroxisome proliferator-activated receptor-gamma co-activator 1 α (PGC1α) activity in breast cells. The predicted probabilities of PGC1α are plotted and compared between breast cancer cells with anchorage-dependent (AD<20 colonies) and anchorage-independent (AI>500 colonies) growth ability by Mann-Whitney U test using GraphPad’s Prism. A bar indicates the mean value for each group. C. Comparison of ribosomal protein expression between breast cancer cells with anchorage-dependent (AD<20 colonies) and anchorage-independent (AI>500 colonies) growth ability. Based on gene symbols from Affymetrix, we compute the average rank of the ribosomal genes to estimate a state of ribosomal biogenesis. Relative expression in the form of average rank is plotted and compared between breast cancer cells with AD and AI growth ability by Mann-Whitney U test using GraphPad’s Prism. A bar indicates the mean value for each group. D. Prediction of the MYC activity in breast cells. The predicted probabilities of MYC are plotted and compared between breast cancer cells with anchorage-dependent (AD<20 colonies) and anchorage-independent (AI>500 colonies) growth ability by Mann-Whitney U test using GraphPad’s Prism. A bar indicates the mean value for each group. E. Gene Set Enrichment Analysis (GSEA) of anchorage-independent growth ability. GSEA revealed enrichment of ribosomal proteins and pentose phosphate pathway with statistical significance (false discovery rate: FDR<0.25). Enrichment score for each sample is further calculated by ASSESS (analysis of sample set enrichment scores) and plotted as bar graphs.
Figure 4
Figure 4. Metastatic potential of breast cancer is predicted by an anchorage-independent growth signature
A and B. Prediction of lung metastasis of primary breast tumors by the gene signature for in vitro anchorage-independent growth ability. Upper panels: Mann-Whitney U test based on anchorage-independent growth ability of GSE2603 (includes both estrogen receptor positive and negative breast cancers; left panel) (A) and GSE5327 (only estrogen receptor negative breast cancers; right panel) (B). The predicted probabilities for anchorage-independent cell growth signature are plotted and compared between breast tumors with and without lung metastasis (Lung Mets) by Mann-Whitney U test using GraphPad’s Prism. A bar indicates the mean value for each group. Lower panels: Kaplan-Meier analysis based on anchorage-independent growth ability of GSE2603 (both of estrogen receptor positive and negative breast cancers; left panel) (A) and GSE5327 (only estrogen receptor negative breast cancers; right panel) (B). X-axis indicates lung metastasis free survival. “Low” (blue) and “High” (red) are defined by being below and above 0.5 of predicted probabilities respectively, the optimal cut-off as determined by a receiver-operator curves (ROC) analysis using GraphPad’s Prism (data not shown). A log rank test was used to evaluate the result statistically using GraphPad’s Prism.
Figure 5
Figure 5. Metastatic potential of lung cancer and melanoma is predicted by the anchorage-independent growth signature
A. Prediction of metastasis of primary lung tumors by the gene signature for in vitro anchorage-independent growth ability. The predictions based on the anchorage-independent signature are shown for a lung tumor dataset that includes tumors with relapse but not with metastasis, and tumors with relapse and metastasis (GSE3593). Predicted probabilities are plotted for the groups with the defined outcome and statistically evaluated using Mann-Whitney U test. A bar indicates the mean value for each group. B. Link with metastatic melanomas and anchorage-independent growth ability of breast cells (GSE8401). Predicted probabilities are plotted for the groups for primary and metastatic tumors, and statistically evaluated using Mann-Whitney U test. A bar indicates the mean value for each group.

References

    1. Bild A, Yao G, Chang JT, Wang Q, Potti A, Chasse D, Joshi M-B, Harpole D, Lancaster JM, Berchuck A, Olson JA, Marks JR, Dressman HK, West M, Nevins JR. Nature. 2006;439:353–357. - PubMed
    1. Calvo S, Jain M, Xie X, Sheth SA, Chang B, Goldberger OA, Spinazzola A, Zeviani M, Carr SA, Mootha VK. Nat Genet. 2006;38:576–82. - PubMed
    1. Campbell PM, Der CJ. Semin Cancer Biol. 2004;14:105–14. - PubMed
    1. Chang JT, Nevins JR. Bioinformatics. 2006;22:2926–2933. - PubMed
    1. Chen EI, Hewel J, Krueger JS, Tiraby C, Weber MR, Kralli A, Becker K, Yates JR, 3rd, Felding-Habermann B. Cancer Res. 2007;67:1472–86. - PubMed

Publication types