

doi: 10.1364/opex.12.002977.
Motion artifacts in optical coherence tomography with frequency-domain ranging
- PMID: 19483816
- PMCID: PMC2752339
- DOI: 10.1364/opex.12.002977
Item in Clipboard
Motion artifacts in optical coherence tomography with frequency-domain ranging
Opt Express.
.
Abstract
We describe results of theoretical and experimental investigations of artifacts that can arise in spectral-domain optical coherence tomography (SD-OCT) and optical frequency domain imaging (OFDI) as a result of sample or probe beam motion. While SD-OCT and OFDI are based on similar spectral interferometric principles, the specifics of motion effects are quite different because of distinct signal acquisition methods. These results provide an understanding of motion artifacts such as signal fading, spatial distortion and blurring, and emphasize the need for fast image acquisition in biomedical applications.
Figures

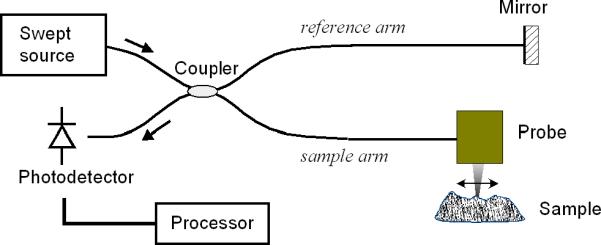
Basic configuration of single-mode-fiber-based SD-OCT.

Illustrations of (a) axial and (b) transverse motion of a sample (scatter layer) and probe beam.

(a) Effective intensity profiles of the probe beam at four different normalized displacements. (b) Mean SNR drop for a random scattering scample as a function of the normalized transverse displacement.

Schematic of the experimental SD-OCT system. ASE; amplified spontaneous emission, G: galvanometer, LSC; line scan camera, DAQ; data acquisition board.
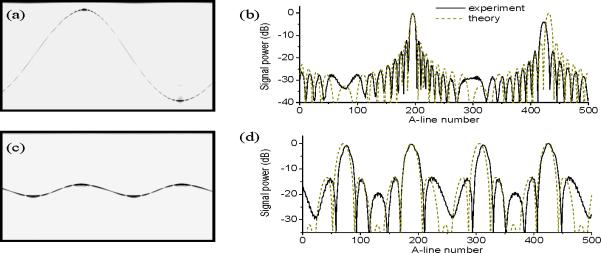
(a) An SD-OCT image (500 A-lines) of a mirror vibrating at a peak-to-peak amplitude of 1.76 mm and frequency of 40 Hz. (b) Maximum signal power measured (solid line, black) and calculated theoretically (dashed line, brown). (c) An image of a mirror moving at an amplitude 0.22 mm and frequency of 80 Hz. (d) Signal power measured (solid line, black) and calculated theoretically (dashed line, brown).

SD-OCT images of a 90-degree prism at various amplitudes of the galvanometer scan voltage. With increasing amplitude, the scan velocity is increased and therefore the image contains fewer A-lines. The scale bars represent 1.0 mm.

(a) Signal peak power (open circles, black) measured from the average of 10 A-line profiles for each normalized displacement. Red line: theorical fit curve for speckle-averaged signal power. (b) Minimum FWHM of the image (open circles, black) obtained from 10 A-line amplitude profiles. Blue line: theoretical curve for axial resolution expected from a mirror sample.

SD-OCT image of a human finger (256 axial × 500 transverse pixels, 2.08 mm × 5 mm) obtained at an A-line rate of 19 kHz. The arrow indicates a skin fold region.
Schematic of single-mode-fiber-based OFDI.
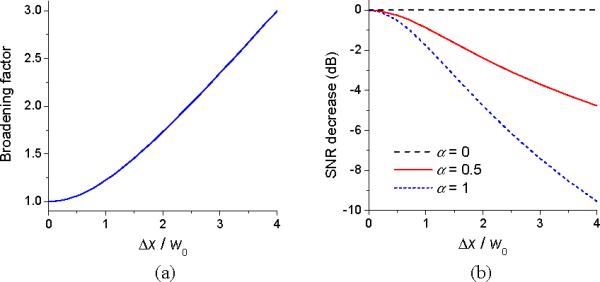
(a) The magnitude of broadening in axial and transverse resolution and (b) SNR decrease arising from transverse motion as a function of normalized displacement Δx/w for σ2 = 0.5.

Experimental setup of the OFDI system.

OFDI images of a moving mirror (amplitude: 0.78 mm, frequency: 30 Hz) acquired at A-line rates of 16, 8, 4, 2, and 1 kHz, respectively. The vertical axis represents the depth over 3.8 mm. The horizontal axis represents the time over 520 A-line acquisition periods. The vibration amplitude in the images is artifactually increased with increasing amount as the A-line acquisition rate decreases by Doppler shift

Normalized amplitude of mirror motion measured from the images of Fig. 12 (circles) and predicted theoretically (line).

(a) Measured A-line profiles (curves 1 to 16, black) obtained at an A-line rate of 2 kHz during a single cycle of sample mirror oscillation. The A-line profile obtained with a stationary mirror at its neutral position is also shown as a reference (curve 0, blue). (b) Simulation results. Curve labeled 17 (green) depicts the trace of actual mirror motion used in the simulation.

(a) Normalized axial resolution obtained at an A-line rate of 2 kHz, normalized to the unperturbed resolution obtained with a stationary mirror. (b) Normalized axial resolution obtained at an A-line rate of 16 kHz. Black circles: measured values. Red line: simulation.

OFDI images of a prism at various amplitudes of the galvanometer scan voltage. With increasing amplitude, the scan velocity is increased and therefore the image contains a fewer number of A-line. The

(a) Signal peak power (squares, black) measured from the average of 10 A-line profiles for each normalized displacement. Red line: theorical curve for speckle-averaged signal power with α = 0.4 in Eq. (26). (b) Normalized minimum FWHM of the image (circles, black) obtained from 10 A-line profiles. Theorical curve of axial resolution assuming a single scatter sample (line, blue).

OFDI image of a human finger near skin fold (300 axial × 300 transverse pixels, 3.8 mm × 5.8 mm) acquired with the OFDI system at an A-line rate of 15.7 kHz.
Similar articles
-
Compensation of motion artifacts in intracoronary optical frequency domain imaging and optical coherence tomography.Int J Cardiovasc Imaging. 2012 Aug;28(6):1299-304. doi: 10.1007/s10554-011-9953-8. Epub 2011 Oct 14. Int J Cardiovasc Imaging. 2012. PMID: 21993895 Free PMC article.
-
Common approach for compensation of axial motion artifacts in swept-source OCT and dispersion in Fourier-domain OCT.Opt Express. 2012 Mar 12;20(6):6761-76. doi: 10.1364/OE.20.006761. Opt Express. 2012. PMID: 22418560
-
Optical Coherence Tomography.2024 Oct 6. In: StatPearls [Internet]. Treasure Island (FL): StatPearls Publishing; 2025 Jan–. 2024 Oct 6. In: StatPearls [Internet]. Treasure Island (FL): StatPearls Publishing; 2025 Jan–. PMID: 39163419 Free Books & Documents.
-
Involuntary eye motion correction in retinal optical coherence tomography: Hardware or software solution?Med Image Anal. 2017 Apr;37:129-145. doi: 10.1016/j.media.2017.02.002. Epub 2017 Feb 4. Med Image Anal. 2017. PMID: 28208100 Free PMC article. Review.
-
Optical Coherence Tomography (OCT): Principle and Technical Realization.2019 Aug 14. In: Bille JF, editor. High Resolution Imaging in Microscopy and Ophthalmology: New Frontiers in Biomedical Optics [Internet]. Cham (CH): Springer; 2019. Chapter 3. 2019 Aug 14. In: Bille JF, editor. High Resolution Imaging in Microscopy and Ophthalmology: New Frontiers in Biomedical Optics [Internet]. Cham (CH): Springer; 2019. Chapter 3. PMID: 32091846 Free Books & Documents. Review.
Cited by
-
Dual beam optical coherence tomography angiography for decoupling axial velocity gradient.Sci Rep. 2024 Aug 22;14(1):19464. doi: 10.1038/s41598-024-68924-4. Sci Rep. 2024. PMID: 39174584 Free PMC article.
-
Prospects of Intraoperative Multimodal OCT Application in Patients with Acute Mesenteric Ischemia.Diagnostics (Basel). 2021 Apr 15;11(4):705. doi: 10.3390/diagnostics11040705. Diagnostics (Basel). 2021. PMID: 33920827 Free PMC article.
-
Ultra-wideband optical coherence elastography from acoustic to ultrasonic frequencies.Nat Commun. 2023 Aug 16;14(1):4949. doi: 10.1038/s41467-023-40625-y. Nat Commun. 2023. PMID: 37587178 Free PMC article.
-
Optical coherence tomography angiography.Prog Retin Eye Res. 2018 May;64:1-55. doi: 10.1016/j.preteyeres.2017.11.003. Epub 2017 Dec 8. Prog Retin Eye Res. 2018. PMID: 29229445 Free PMC article. Review.
-
Flexible A-scan rate MHz-OCT: efficient computational downscaling by coherent averaging.Biomed Opt Express. 2020 Oct 29;11(11):6799-6811. doi: 10.1364/BOE.402477. eCollection 2020 Nov 1. Biomed Opt Express. 2020. PMID: 33282524 Free PMC article.
References
-
- Bankman N. Handbook of medical imaging. Academic Press; San Diego: 2000.
-
- Alfidi RJ, MacIntyre WJ, Haaga R. The effects of biological motion in CT resolution. Am. J. Radiol. 1976;127:11–15. - PubMed
-
- Wood ML, Henkelman RM. NMR image artifact from periodic motion. Med. Phys. 1985;12:143–151. - PubMed
-
- Nadkarni SK, Boughner DR, Drangova M, Fenster A. In vitro simulation and quantification of temporal jitter artifacts in ECG-gated dynamic three-dimensional echocardiography. Ultrasound in Med. & Biol. 2001;27:211–222. - PubMed
Grants and funding
LinkOut - more resources
Full Text Sources
Other Literature Sources
