. 2009 Jun;11(6):518-28, 4 p following 528.
doi: 10.1593/neo.81674.

Urokinase-type plasminogen activator receptor transcriptionally controlled adenoviruses eradicate pancreatic tumors and liver metastasis in mouse models

Affiliations

Urokinase-type plasminogen activator receptor transcriptionally controlled adenoviruses eradicate pancreatic tumors and liver metastasis in mouse models

Meritxell Huch et al. Neoplasia. 2009 Jun.

Abstract

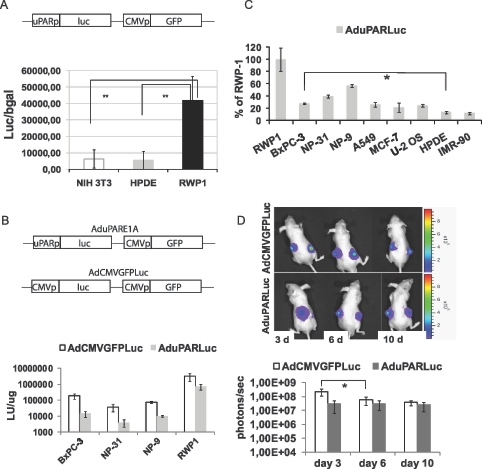
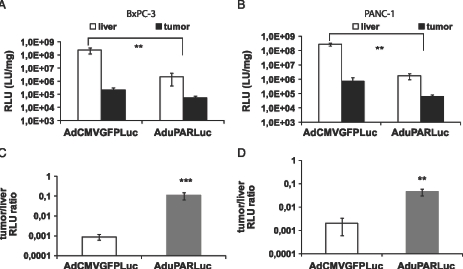
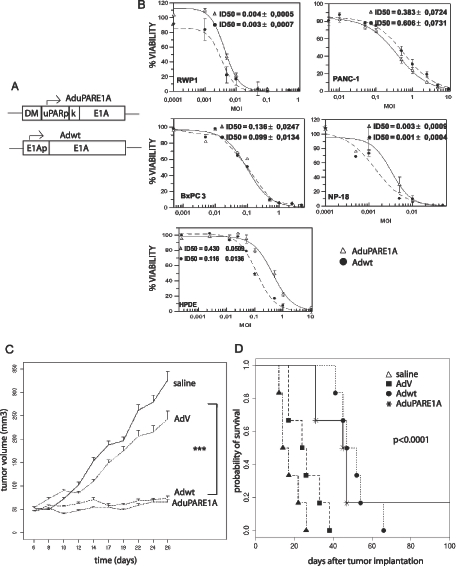
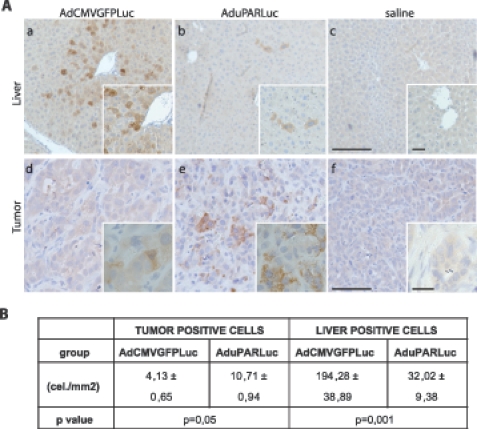
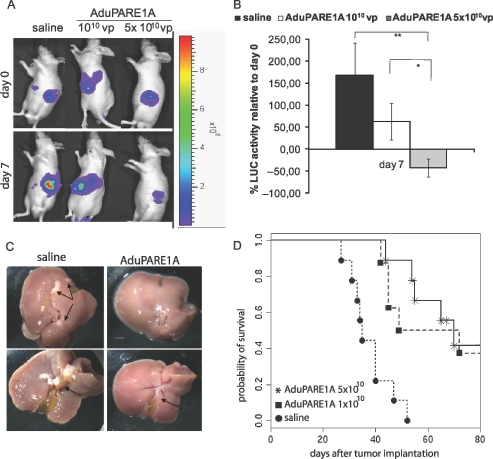
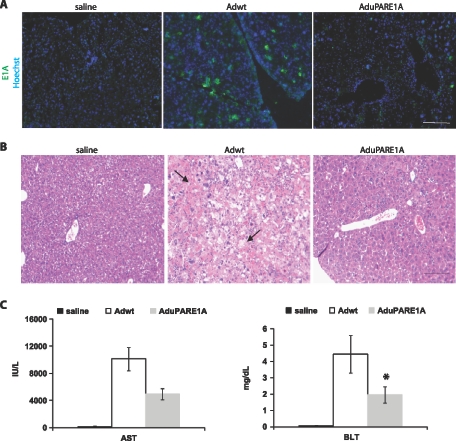
Treatment options for pancreatic cancer have shown limited success mainly owing to poor selectivity for pancreatic tumor tissue and to a lack of activity in the tumor. In this study, we describe the ability of the urokinase-type plasminogen activator receptor (uPAR) promoter to efficiently and selectively target pancreatic tumors and metastases, which enables the successful management of pancreatic cancer. We have generated a replication-defective reporter adenovirus, AduPARLuc, and a conditionally replicating adenovirus, AduPARE1A, and we have studied the selectivity and antitumoral efficacy in pancreatic tumors and metastases. Toxicity was studied on intravascular delivery. We demonstrate that the uPAR promoter is highly active in pancreatic tumors but very weak in normal tissues. Tumor specificity is evidenced by a 100-fold increase in the tumor-to-liver ratio and by selective targeting of liver metastases (P < .001). Importantly, the AduPARE1A maintains the oncolytic activity of the wild-type virus, with reduced toxicity, and exhibits significant antitumoral activity (25% tumor eradication) and prolonged survival in pancreatic xenograft models (P < .0001). Furthermore, upon intravascular delivery, we demonstrate complete eradication of liver metastasis in 33% of mice, improving median survival (P = 5.43 x 10(-5)). The antitumoral selective activity of AduPARE1A shows the potential of uPAR promoter-based therapies in pancreatic cancer treatment.


Figures

Figure 1
Figure 1
uPAR promoter activity in pancreatic cancer cell lines and in pancreatic tumors. (A) NIH3T3, HPDE, and RWP1 cells were transfected with the plasmid pAdTrackuPARLuc (shown in the scheme). To normalize for transfection efficiency, pCMVβGal plasmid was used. Forty-eight hours later, luciferase and β-galactosidase activities were determined. Results are expressed as light units (LU) relative to β-galactosidase activity and are shown as the mean ± SEM of three independent experiments. **P = .006, HPDE versus RWP1; **P = .002, NIH3T3 versus RWP1. (B) A total of 20,000 cells/well were seeded in triplicate and infected with either AduPARLuc or AdCMVGFPLuc at 104 vp/cell. Luciferase activity was quantified 72 hours after viral transduction and normalized to total protein levels. Results are expressed as light units per microgram protein. Values are represented as the mean ± SEM of four independent experiments. (C) Percentage of uPAR/CMV luciferase ratio relative to the uPAR/CMV luciferase ratio for RWP1 cells. Values are represented as the mean ± SEM of three or four independent experiments. *P < .05. (D) A total of 3 x 10⁶ BxPC-3 cells were injected SC into each posterior flank of nude mice. When tumors achieved a mean volume of 100 mm3, they were randomized and injected intratumorally with a single 2.5 x 10¹⁰ vp dose of AdCMVGFPLuc (n = 9) or AduPARLuc (n = 10). Shown are representative images and quantification of bioluminescent emission from mice receiving AdCMVGFPLuc (upper panel) or AduPARLuc (lower panel) at days 3, 6, and 10 after viral injection. Results are expressed as photons per second. Values are represented as mean ± SEM. *P = .03.
Figure 2
Figure 2
uPAR promoter tumor-to-liver ratio. A total of 3 x 10⁶ BxPC-3 cells (A and C) or 2.5 x 10⁶ PANC-1 cells (B and D) were injected SC into each posterior flank of nude mice. Once tumors were established, animals received 5 x 10¹⁰ vp of AdCMVGFPLuc (n = 4 mice; n = 8 tumors) or AduPARLuc (n = 4 mice; n = 8 tumors) or saline solution (n = 2 mice; n = 4 tumors) through the tail vein. Mice were killed 5 days after virus injection, and tumor and liver extracts were assayed for luciferase activity. (A and B) Luciferase activity from liver and tumor tissues. Luciferase activity from the saline group was considered background and subtracted from the viral groups. Results are expressed as light units per milligram of tissue (LU/mg). Values are represented as mean ± SEM. **P < .01, ***P < .001. (C and D) Tumor-to-liver ratio. Values are represented as mean ± SEM of tumor RLU relative to liver RLU. **P < .01.
Figure 3
Figure 3
Antitumoral effect of AduPARE1A in pancreatic cancer cells lines, HPDE cells and in BxPC-3 SC xenografts. (A) Schematic representation of the AduPARE1A and Adwt viruses. DM indicates myotonic dystrophy fragment; K, Kozak sequence. (B) A total of 3 x 10³ cells/well were seeded in triplicate and infected with a dose range of 0 to 10 multiplicities of infection of Adwt or AduPARE1A. Cell viability was measured by MTT assay 4 days later and is expressed as the percentage of absorbance of treated wells compared with that of mock-infected cultures. Dose-response curves and ID50 values, obtained by a standard nonlinear model based on the Hill equation, are shown as the mean ± SEM of three independent experiments. -●-, Adwt; -Δ-, AduPARE1A. (C) Animals bearing BxPC-3 SC tumors were randomized to four groups: two control groups, namely, saline (n = 11 tumors) and AdV (n = 11 tumors), and two treated groups, namely, Adwt (n = 12 tumors) and AduPARE1A (n = 12 tumors). Animals received intratumoral injections of 107 pfu/tumor at days 6 and 14 after tumor implantation. Tumor growth curves are plotted as mean tumor volume ± SEM. ***P < .0001. (D) Kaplan-Meier survival curves (log-rank test, < .0001). End point (animals with a tumor volume, ≥300 mm3).
Figure 4
Figure 4
AduPARLuc expression in liver metastasis model. Animals bearing PANC-1 tumor metastases received saline solution (n = 3) or 5 x 10¹⁰ vp of AdCMVGFPLuc (n = 3) or AduPARLuc (n = 3) IV. Three days later, animals were killed, livers were excised, and luciferase expression was determined by immunohistochemistry with a polyclonal anti-luciferase antibody. (A) Representative images of luciferase expression in liver (a, b, c) and tumor areas (d, e, f) of animals injected with AdCMVGFPLuc or AduPARLuc or saline. (a, b, c) Scale bar, 200 µm; original magnifications, 100 µm. (d, e, f) Scale bar, 50 µm; original magnifications, 20 µm. (B) Stereological analysis. Quantification of luciferase-positive cells in the liver and tumor. Values are shown as the mean ± SEM of three animals. Results are expressed as cells per total area analyzed (cells/mm2).
Figure 5
Figure 5
Antitumoral effect of AduPARE1A in PANC-1-Luc liver metastasis model. PANC-1-Luc cells were injected intrasplenically into BALB/c male mice. Six days after tumor implantation bioluminescent activity was recorded (day 0). The day after, animals received a single IV injection, of either saline (n = 10) or AduPARE1A at 1010 vp/animal (n = 8) or AduPARE1A at 5 x 10¹⁰ vp/animal (n = 10) in a Vf = 0.2 ml. (A) Bioluminescent images of liver metastases-bearing mice at days 0 and 7 after adenoviral treatment. (B) Bioluminescent emission quantification at day 7 relative to day 0. **P = .005, *P = .02. (C) Representative images of livers excised at day 21 after treatment. Tumor nodules and bile duct obstruction are shown in the saline group (arrows, left panels). Normal bile duct in the 5 x 10¹⁰ AduPARE1A-injected animals (arrow, right panels). Scale bar, 1.7 cm. (D) Kaplan-Meier survival curves. AduPARE1A 1010 vp versus saline log-rank test = .003; AduPARE1A 5 x 10¹⁰ vp versus saline log-rank test = 5.43 x 10⁻⁵. End point (decreased body weight ≥20% or animal experiencing jaundice).
Figure 6
Figure 6
AduPARE1A toxicity studies. BALB/c immunocompetent mice received IV saline solution (n = 6) or 5 x 10¹⁰ vp of Adwt (n = 6) or 5 x 10¹⁰ vp of AduPARE1A (n = 6). Five days later, blood samples were collected. Next, animals were killed, and the liver tissue excised was frozen in OCT or fixed and embedded in paraffin. (A) E1A expression in the liver tissue. Nuclei were stained with Hoechst. Scale bar, 100 µm. (B) Hematoxylin and eosin staining of liver tissue. Necrotic and swollen hepatocytes (arrows). Scale bar, 1.3 cm. (C) AST and BLT determination. *P < .05.

Similar articles

Cited by

References

    1. Rustgi AK. The molecular pathogenesis of pancreatic cancer: clarifying a complex circuitry. Genes Dev. 2006;20:3043–3053. - PubMed
    1. Saif MW. Pancreatic cancer: are we moving forward yet? Highlights from the Gastrointestinal Cancers Symposium. Orlando, FL, USA. January 20th, 2007. JOP. 2007;8:166–176. - PubMed
    1. Alemany R. Cancer selective adenoviruses. Mol Aspects Med. 2007;28:42–58. - PubMed
    1. Nemunaitis J, Senzer N, Sarmiento S, Zhang YA, Arzaga R, Sands B, Maples P, Tong AW. A phase I trial of intravenous infusion of ONYX-015 and enbrel in solid tumor patients. Cancer Gene Ther. 2007;14:885–893. - PubMed
    1. Hecht JR, Bedford R, Abbruzzese JL, Lahoti S, Reid TR, Soetikno RM, Kirn DH, Freeman SM. A phase I/II trial of intratumoral endoscopic ultrasound injection of ONYX-015 with intravenous gemcitabine in unresectable pancreatic carcinoma. Clin Cancer Res. 2003;9:555–561. - PubMed

Publication types

MeSH terms

Substances

LinkOut - more resources