

Use of the Teager-Kaiser Energy operator for muscle activity detection in children
- PMID: 19484385
- PMCID: PMC2763136
- DOI: 10.1007/s10439-009-9727-9
Use of the Teager-Kaiser Energy operator for muscle activity detection in children
Abstract
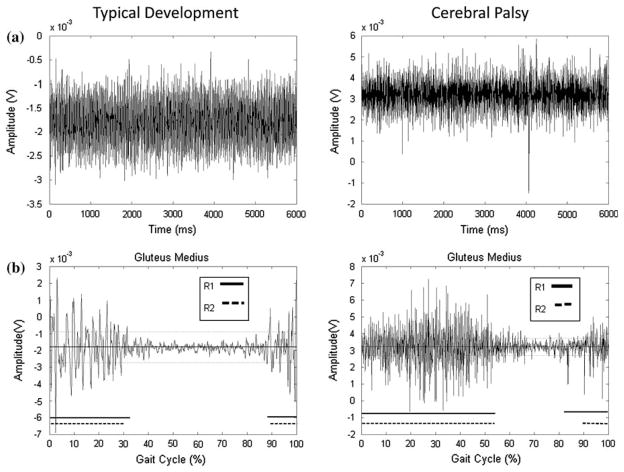
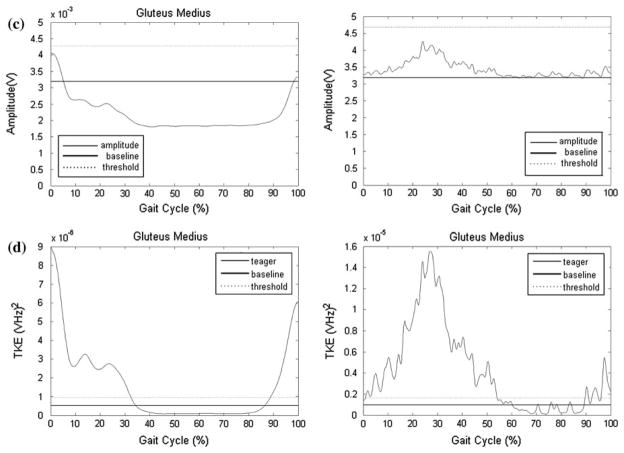
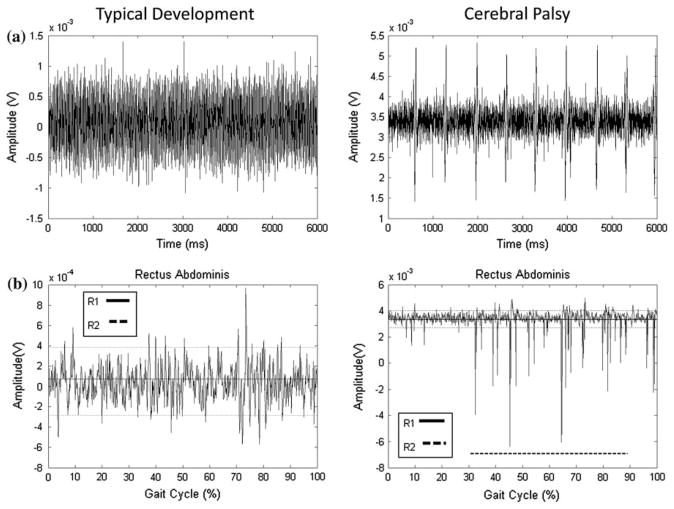
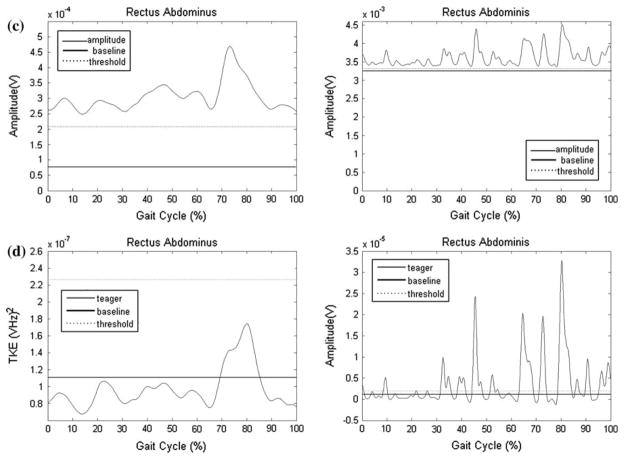
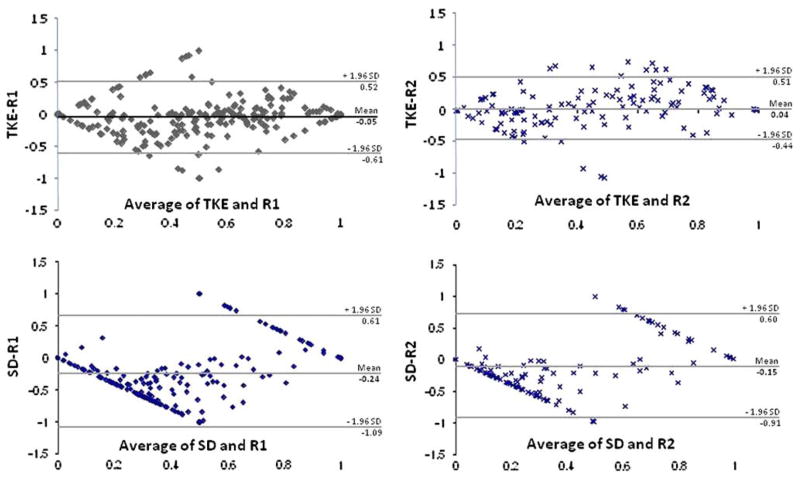
The purpose of this study was to demonstrate the usefulness of the Teager-Kaiser Energy (TKE) operator to assess surface electromyographic (sEMG) activity from the hip and trunk muscles during pediatric gait in children with and without cerebral palsy (CP). Muscle activity was recorded from the trapezius, erector spinae, rectus abdominus, external oblique, gluteus maximus and medius, rectus femoris, and semitendinosus bilaterally in ten children with typical development (TD) and five children with CP ages 44.4 +/- 18.6 months. Duration of muscle activity was calculated as a percentage of the gait cycle, and compared to two common onset detection methods, a standard deviation (SD) amplitude threshold method, and the visual inspection from two raters (R1, R2). Relative and absolute agreement was determined using intraclass correlation coefficients (ICCs) and Bland-Altman plots. Of the two automated methods, the TKE method demonstrated better agreement with visual inspection (0.45-0.89) than the SD (0.11-0.76) method. The Bland-Altman plots indicated a smaller bias and 95% confidence interval for the TKE method in comparison to the raters (TKE to R1: -5, 113%; TKE to R2: 4, 95%; SD to R1: -24, 170%; SD to R2: -15, 151%). The use of the TKE operator may better detect sEMG activity in children than the standard amplitude method.
Figures
Similar articles
-
Are electromyographic patterns during gait related to abnormality level of the gait in patients with spastic cerebral palsy?Acta Bioeng Biomech. 2016;18(3):91-96. Acta Bioeng Biomech. 2016. PMID: 27840431
-
Muscle synergy analysis in children with cerebral palsy.J Neural Eng. 2015 Aug;12(4):046017. doi: 10.1088/1741-2560/12/4/046017. Epub 2015 Jun 10. J Neural Eng. 2015. PMID: 26061115
-
Trunk and hip muscle activation patterns are different during walking in young children with and without cerebral palsy.Phys Ther. 2010 Jul;90(7):986-97. doi: 10.2522/ptj.20090161. Epub 2010 Apr 29. Phys Ther. 2010. PMID: 20430948 Free PMC article.
-
Reliability of surface electromyography timing parameters in gait in cervical spondylotic myelopathy.J Electromyogr Kinesiol. 2011 Dec;21(6):1004-10. doi: 10.1016/j.jelekin.2011.09.003. Epub 2011 Oct 8. J Electromyogr Kinesiol. 2011. PMID: 21986038
-
Electromyographic activity in deadlift exercise and its variants. A systematic review.PLoS One. 2020 Feb 27;15(2):e0229507. doi: 10.1371/journal.pone.0229507. eCollection 2020. PLoS One. 2020. PMID: 32107499 Free PMC article.
Cited by
-
Wiener filtering of surface EMG with a priori SNR estimation toward myoelectric control for neurological injury patients.Med Eng Phys. 2014 Dec;36(12):1711-5. doi: 10.1016/j.medengphy.2014.09.008. Epub 2014 Oct 29. Med Eng Phys. 2014. PMID: 25443536 Free PMC article.
-
A comparison of two procedures for verbal response time fractionation.Front Psychol. 2014 Oct 24;5:1213. doi: 10.3389/fpsyg.2014.01213. eCollection 2014. Front Psychol. 2014. PMID: 25386153 Free PMC article.
-
A knowledge discovery methodology from EEG data for cyclic alternating pattern detection.Biomed Eng Online. 2018 Dec 18;17(1):185. doi: 10.1186/s12938-018-0616-z. Biomed Eng Online. 2018. PMID: 30563526 Free PMC article.
-
Unsupervised Stochastic Strategies for Robust Detection of Muscle Activation Onsets in Surface Electromyogram.IEEE Trans Neural Syst Rehabil Eng. 2018 Jun;26(6):1279-1291. doi: 10.1109/TNSRE.2018.2833742. IEEE Trans Neural Syst Rehabil Eng. 2018. PMID: 29877853 Free PMC article.
-
Neuromechanical adaptations during a robotic powered exoskeleton assisted walking session.J Spinal Cord Med. 2018 Sep;41(5):518-528. doi: 10.1080/10790268.2017.1314900. Epub 2017 Apr 20. J Spinal Cord Med. 2018. PMID: 28427305 Free PMC article.
References
-
- Davis MF, Worden K, Clawson D, Meaney J, Duncan B. Confirmatory factor analysis in osteopathic medicine: fascial and spinal motion restrictions as correlates of muscle spasticity in children with cerebral palsy. J Am Osteopath Assoc. 2007;107:226–232. - PubMed
-
- Di Fabio RP. Reliability of computerized surface electromyography for determining the onset of muscle activity. Phys Ther. 1987;67(1):43–48. - PubMed
Publication types
MeSH terms
Grants and funding
LinkOut - more resources
Full Text Sources
Other Literature Sources
Medical
Miscellaneous
