

Psychometric approaches for developing commensurate measures across independent studies: traditional and new models
- PMID: 19485624
- PMCID: PMC2780030
- DOI: 10.1037/a0015583
Psychometric approaches for developing commensurate measures across independent studies: traditional and new models
Erratum in
- Psychol Methods. 2009 Dec;14(4):iv
Abstract
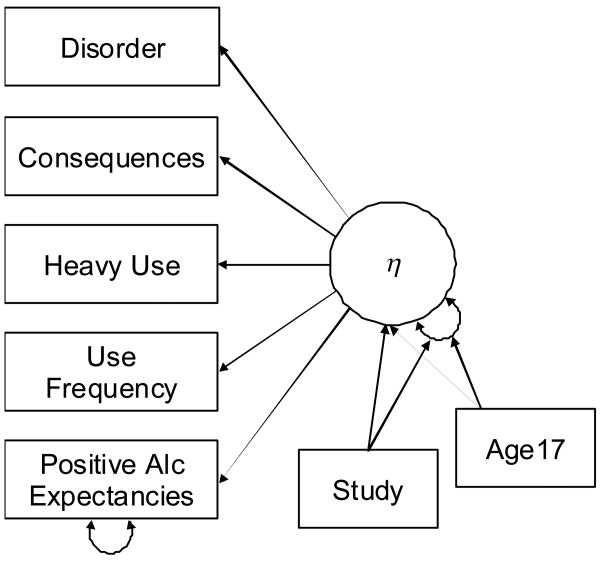
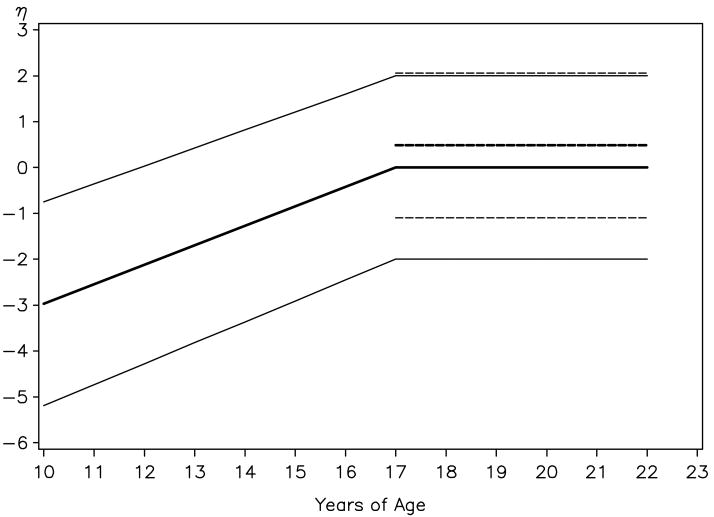
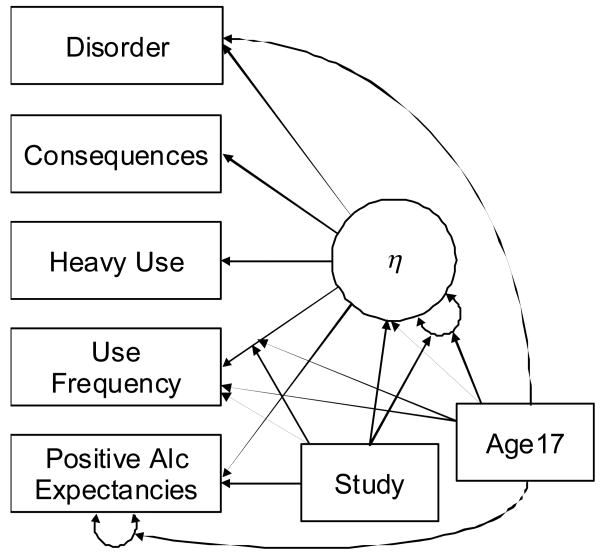
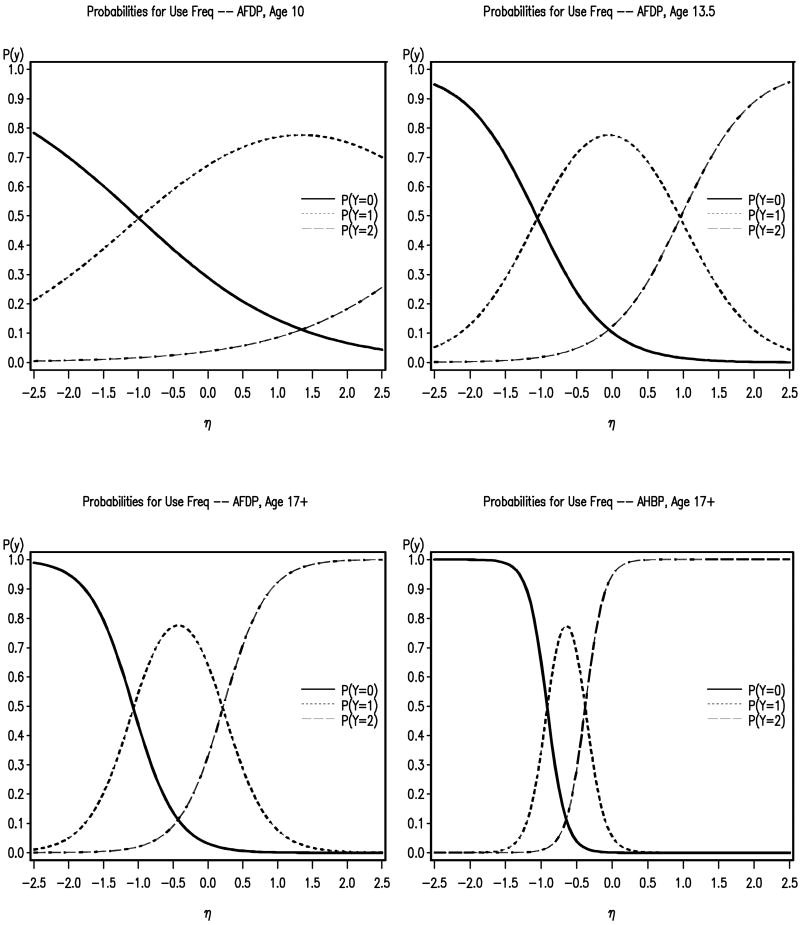
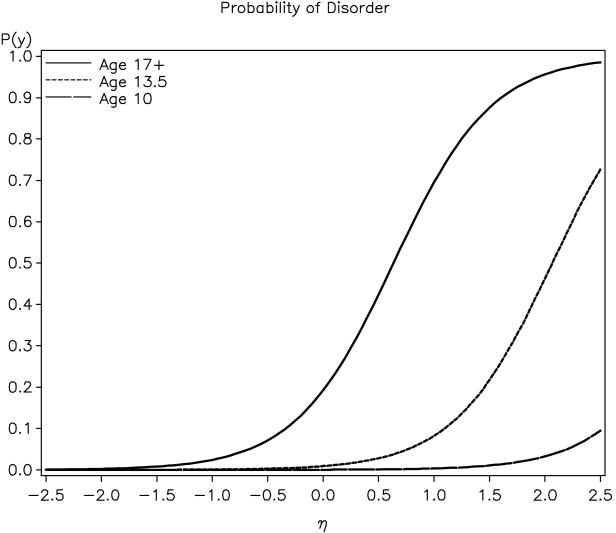
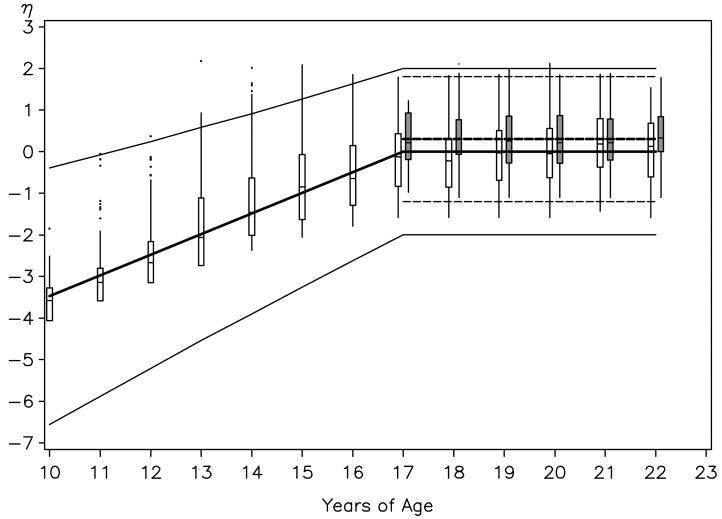
When conducting an integrative analysis of data obtained from multiple independent studies, a fundamental problem is to establish commensurate measures for the constructs of interest. Fortunately, procedures for evaluating and establishing measurement equivalence across samples are well developed for the linear factor model and commonly used item response theory models. A newly proposed moderated nonlinear factor analysis model generalizes these models and procedures, allowing for items of different scale types (continuous or discrete) and differential item functioning across levels of categorical and/or continuous variables. The potential of this new model to resolve the problem of measurement in integrative data analysis is shown via an empirical example examining changes in alcohol involvement from ages 10 to 22 years across 2 longitudinal studies.
(PsycINFO Database Record (c) 2009 APA, all rights reserved).
Figures
References
-
- Achenbach T, Edelbrock C. The classification of child psychopathology: A review and analysis of empirical efforts. Psychological Bulletin. 1981;85:1275–1301. - PubMed
-
- Angoff WH. Perspectives on differential item functioning methodology. In: Holland PW, Wainer H, editors. Differential Item Functioning. Hillsdale, NJ: Lawrence Erlbaum Associates; 1993. pp. 3–23.
-
- Arbuckle JL. Full information estimation in the presence of incomplete data. In: Marcoulides GA, Schumacker RE, editors. Advanced structural equation modeling: Issues and techniques. Hillsdale, NJ: Erlbaum; 1996. pp. 243–277.
-
- Bartholomew DJ, Knott M. Latent variable models and factor analysis. 2nd. London: Arnold; 1999.
-
- Bauer DJ. Estimating multilevel linear models as structural equation models. Journal of Educational and Behavioral Statistics. 2003;28:135–167.
