. 2009 Jun;35(3):835-54.
doi: 10.1037/a0012726.

Proactive adjustments of response strategies in the stop-signal paradigm

Affiliations

Proactive adjustments of response strategies in the stop-signal paradigm

Frederick Verbruggen et al. J Exp Psychol Hum Percept Perform. 2009 Jun.

Abstract

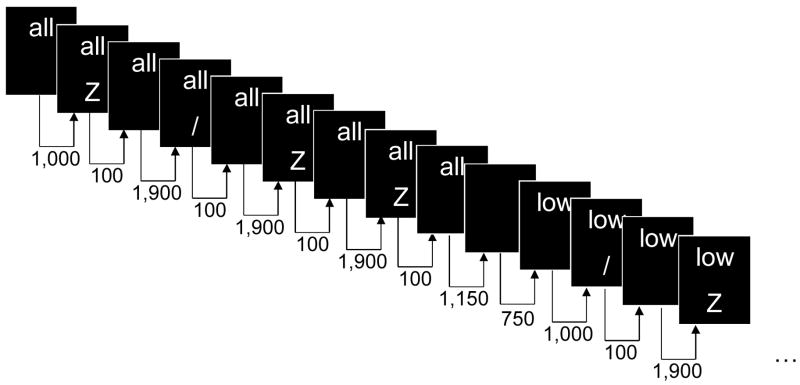
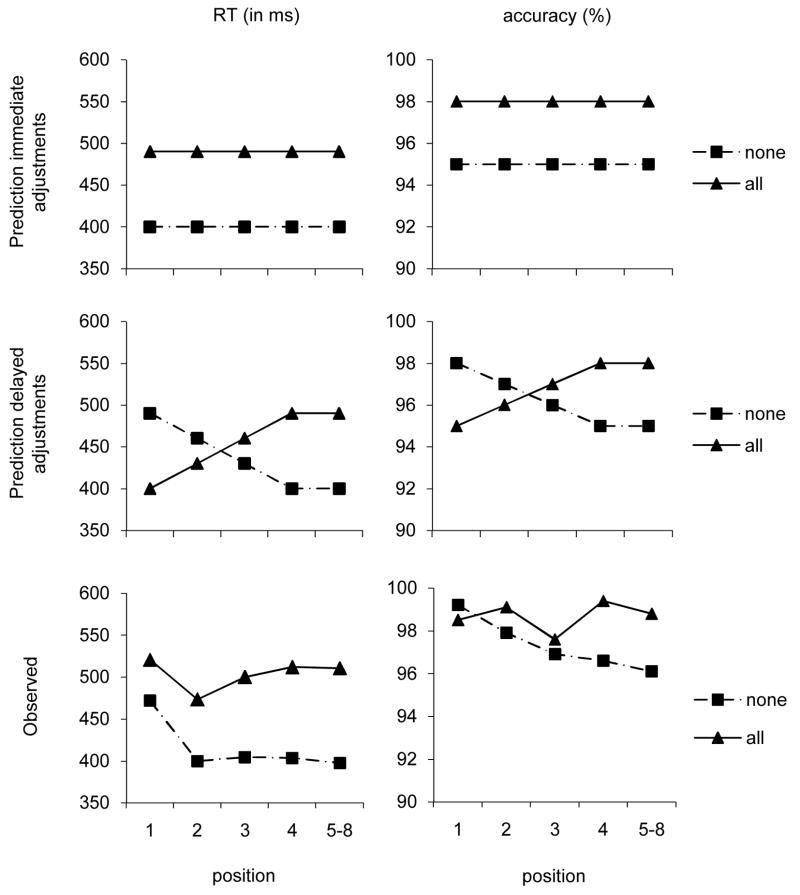
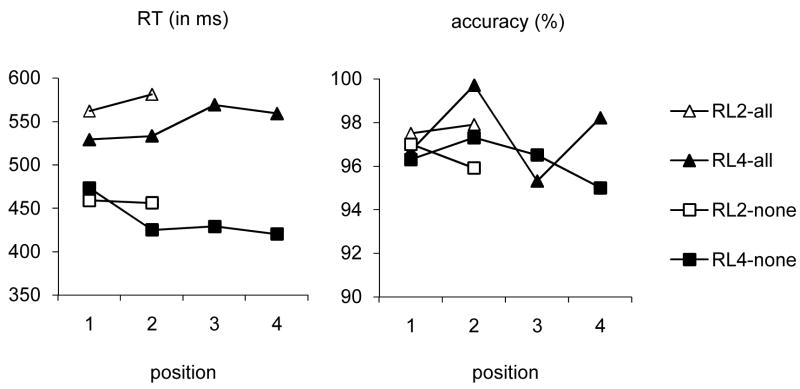
In the stop-signal paradigm, fast responses are harder to inhibit than slow responses, so subjects must balance speed in the go task with successful stopping in the stop task. In theory, subjects achieve this balance by adjusting response thresholds for the go task, making proactive adjustments in response to instructions that indicate that relevant stop signals are likely to occur. The 5 experiments reported here tested this theoretical claim, presenting cues that indicated whether or not stop signals were relevant for the next few trials. Subjects made proactive response-strategy adjustments in each experiment: Diffusion-model fits showed that response threshold increased when participants expected stop signals to occur, slowing go responses and increasing accuracy. Furthermore, the results show that subjects can make proactive response-strategy adjustments on a trial-by-trial basis, suggesting a flexible cognitive system that can proactively adjust itself in changing environments.


Figures

Figure 1
Figure 1
Illustration of the probabilities of responding [p(respond|signal)] based on the horse-race model (Logan & Cowan, 1984), given the distribution of no-stop-signal reaction times (no-stop-signal RT), the stop-signal delay (SSD) and the stop-signal reaction time (SSRT). P(respond|signal) is represented by the area under the curve to the left of each dashed line
Figure 2
Figure 2
A: RTs (X-axis) and accuracy scores (Y-axis) predicted by the proactive-adjustment hypothesis and the two versions of the dual-task requirements hypothesis [version 1: only non-decision time(t0) is influenced; version 2: non-decision time and growth rate (v) are influenced]. B: diffusion parameters (threshold, growth and non-decision time) for the stop-signal contexts (none or all) predicted by the proactive-adjustment hypothesis and the two versions of the dual-task requirements hypothesis. Growth rate corresponds to the slopes of the lines. Non-decision time = stimulus processing + response execution. For purposes of clarity, we depicted total non-decision time as the time before the information starts to accumulate.
Figure 3
Figure 3
The sequence of events (from left to right). The numbers on the right indicate the position within a run of trials. The numbers on the left indicate the cue-presentation durations and stimulus-presentation durations (ms).
Figure 4
Figure 4
Figure 4A. Observed RT (X-axis) and accuracy (Y-axis) for each context for Experiments 1 and 2. B: Estimated decision and non-decision time for each context for Experiments 1 and 2. Growth rate = accumulated evidence per second and response threshold (dotted lines) = boundary separation/2. Decision time = response threshold/growth rate. Non-decision time = stimulus processing + response execution. For purposes of clarity, we depicted total non-decision time as the time before the information starts to accumulate.
Figure 5
Figure 5
Figure 5A. Observed RT (X-axis) and accuracy (Y-axis) for each context and for each run length condition in Experiments 3. B: Estimated decision and non-decision time for each context and for each run length condition in Experiments 3. Growth rate = accumulated evidence per second and response threshold (dotted lines) = boundary separation/2. Decision time = response threshold/growth rate. Non-decision time = stimulus processing + response execution. For purposes of clarity, we depicted total non-decision time as the time before the information starts to accumulate.
Figure 6
Figure 6
Figure 6A. Observed RT (X-axis) and accuracy (Y-axis) for each context for Experiments 4 and 5. Note: l/h = low/high context. B: Estimated decision and non-decision time for each context for Experiments 4 and 5. Note: l/h = low/high context. Growth rate = accumulated evidence per second and response threshold (dotted lines) = boundary separation/2. Decision time = response threshold/growth rate. Non-decision time = stimulus processing + response execution. For purposes of clarity, we depicted total non-decision time as the time before the information starts to accumulate.
Figure A1
Figure A1
Top and middle panels: Predicted mean RT (left panel) and accuracy (right panel) for each context as a function of the trial position. When subjects make proactive response-strategy adjustments at the beginning of a run of trials, RT and accuracy should not be influenced by trial position; when response-strategy adjustments are made throughout a run of trials, RT and accuracy should be influenced by trial position. Bottom panels: Observed mean RT (left panel) and accuracy (right panel) for each context as a function of the trial position in Experiment 1.
Figure B1
Figure B1
Mean RT (left panel) and accuracy (right panel) for each context and run-length condition (RL2 = run length 2 or RL4 = run length 4) as a function of the trial position in Experiment 3.
Figure C1
Figure C1
Mean RT (left panel) and accuracy (right panel) for the 0% and 30% context in Experiment 5.

References

    1. Aron AR, Behrens TE, Smith S, Frank MJ, Poldrack RA. Triangulating a cognitive control network using diffusion-weighted magnetic resonance imaging (MRI) and functional MRI. Journal of Neuroscience. 2007;27:3743–3752. - PMC - PubMed
    1. Baddeley A. Exploring the central executive. Quarterly Journal of Experimental Psychology. 1996;49A:5–28.
    1. Band GPH, van der Molen MW, Logan GD. Horse-race model simulations of the stop-signal procedure. Acta Psychologica. 2003;112:105–142. - PubMed
    1. Bedard AC, Nichols S, Barbosa JA, Schachar R, Logan GD, Tannock R. The development of selective inhibitory control across the life span. Developmental Neuropsychology. 2002;21:93–111. - PubMed
    1. Botvinick MM, Braver TS, Barch DM, Carter CS, Cohen JD. Conflict monitoring and cognitive control. Psychological Review. 2001;108:624–652. - PubMed

Publication types