. 2010 Mar;20(2):323-42.
doi: 10.1111/j.1750-3639.2009.00275.x. Epub 2009 May 22.

Differential expression of utrophin-A and -B promoters in the central nervous system (CNS) of normal and dystrophic mdx mice

Affiliations

Differential expression of utrophin-A and -B promoters in the central nervous system (CNS) of normal and dystrophic mdx mice

Santhosh M Baby et al. Brain Pathol. 2010 Mar.

Abstract

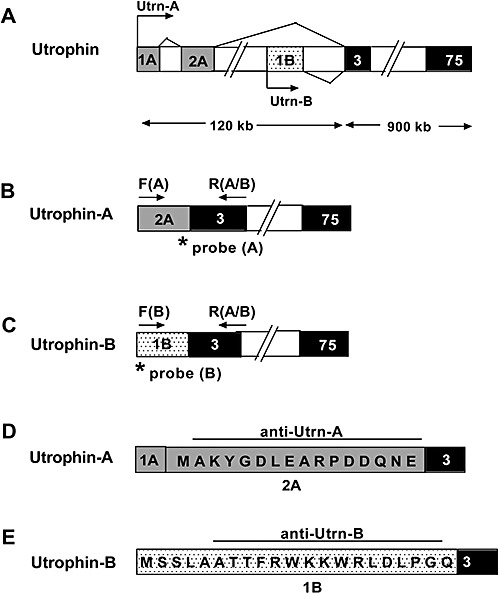
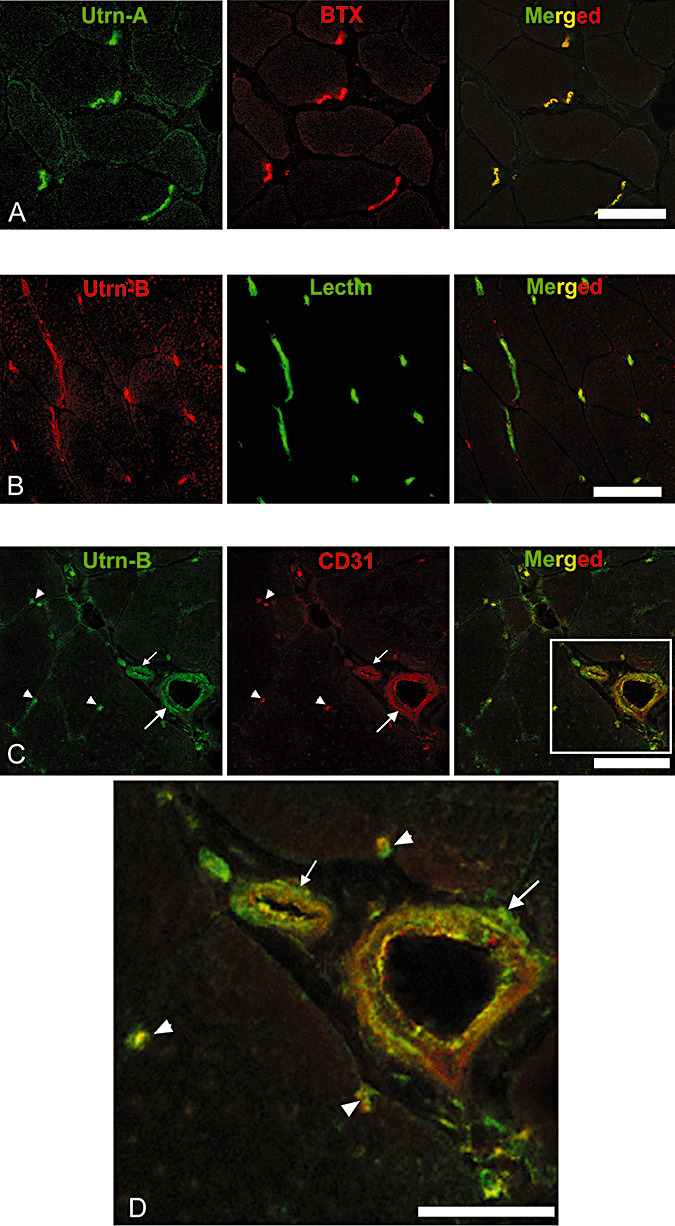
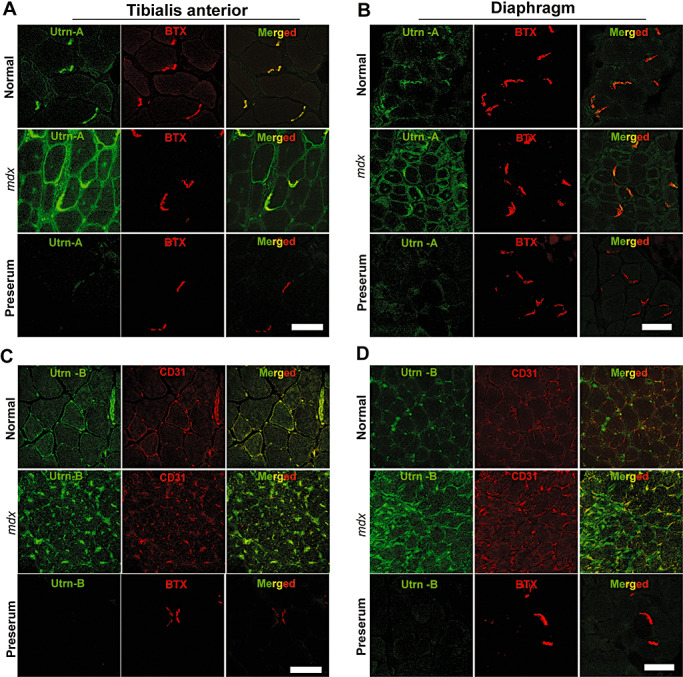
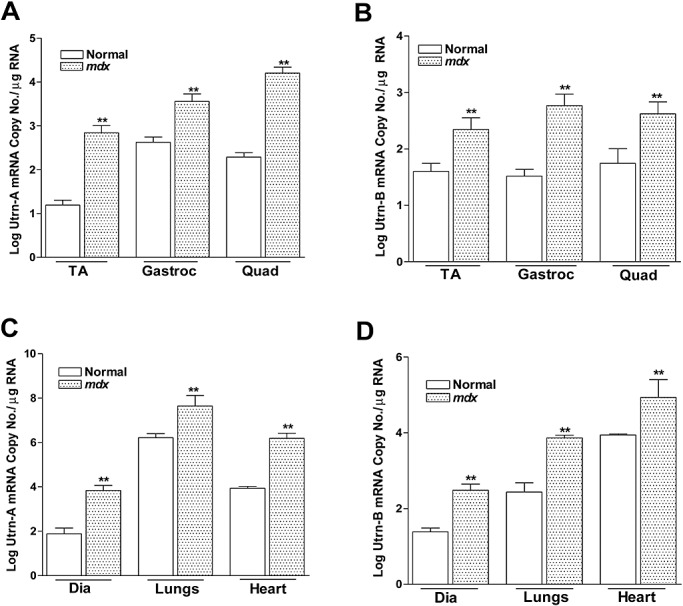
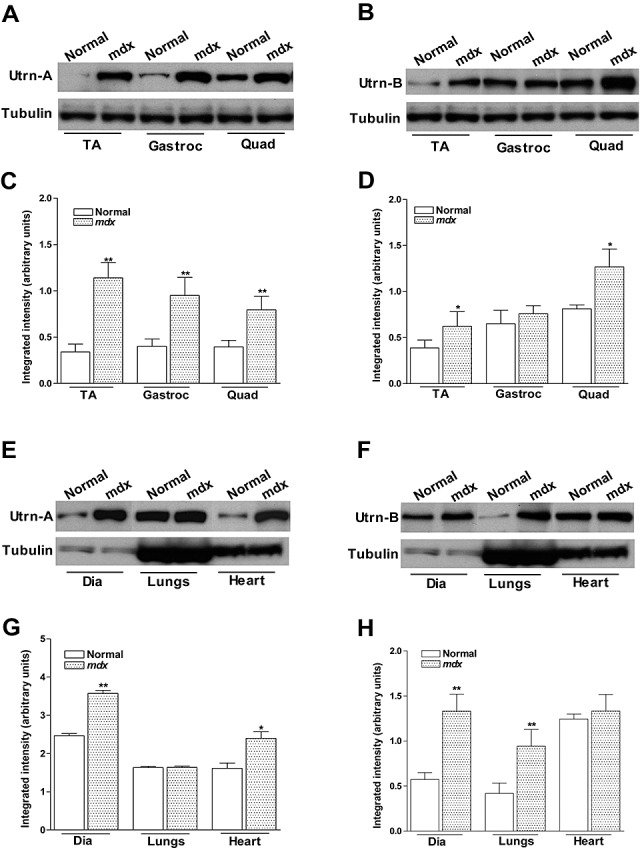
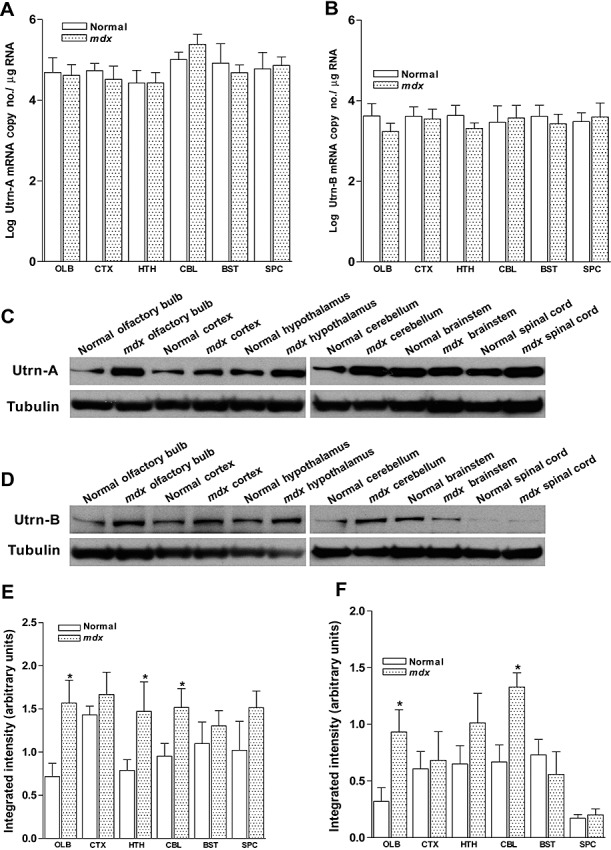
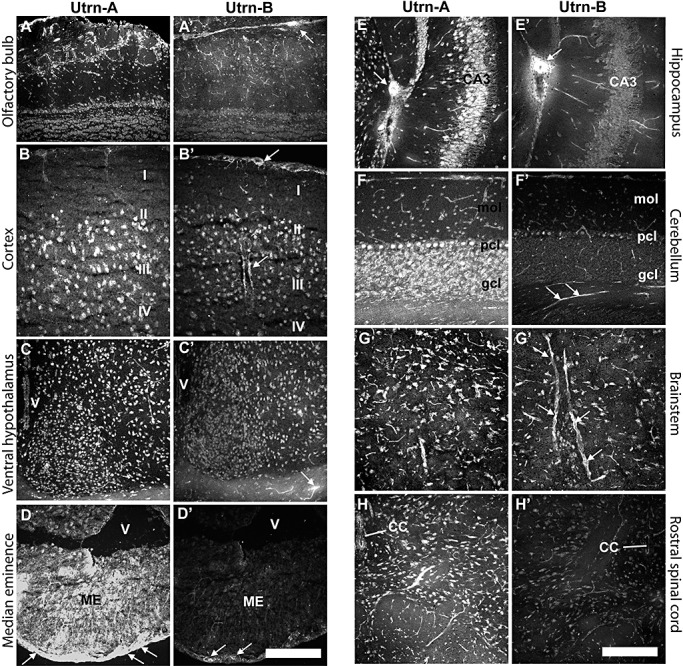
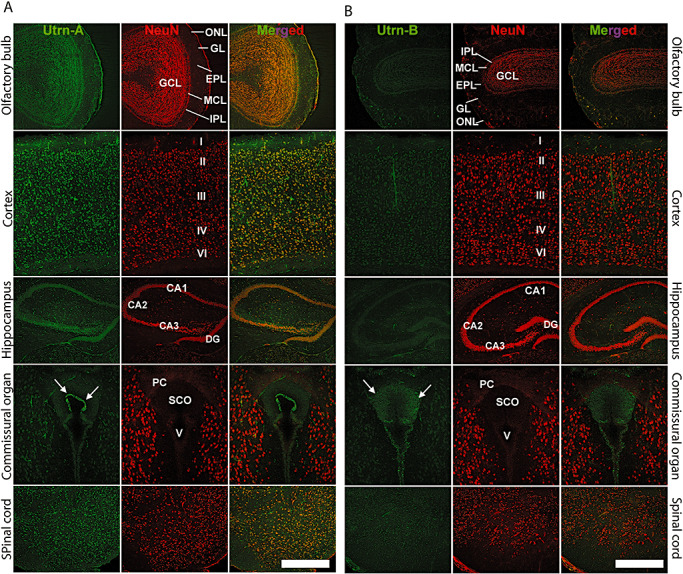
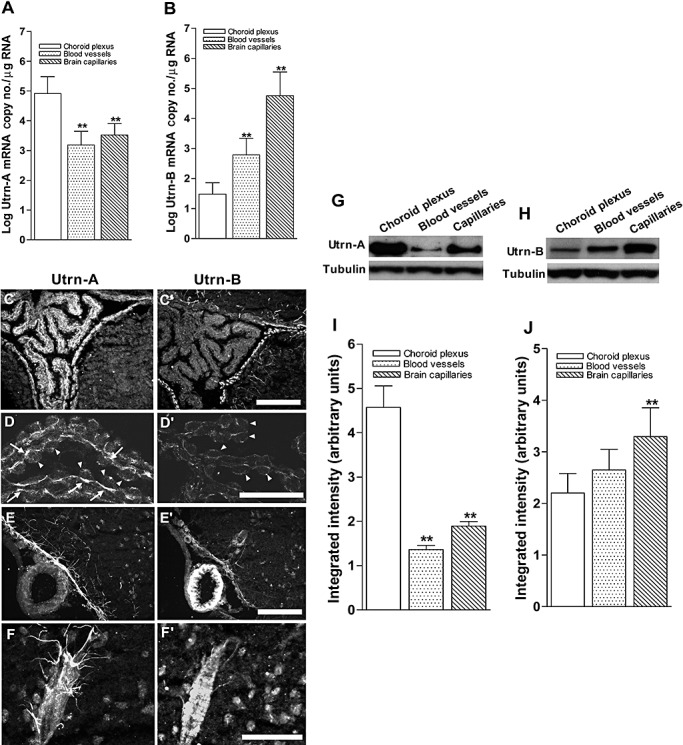
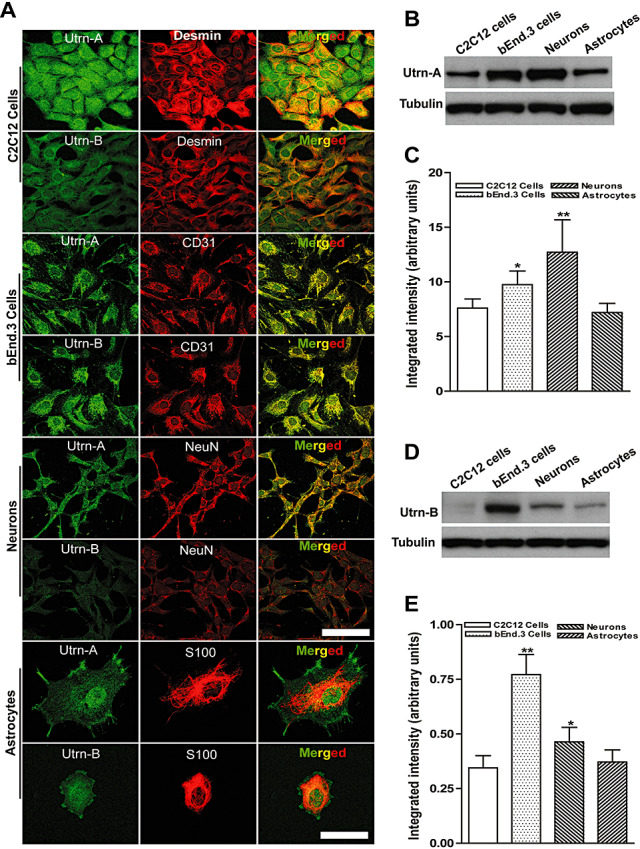
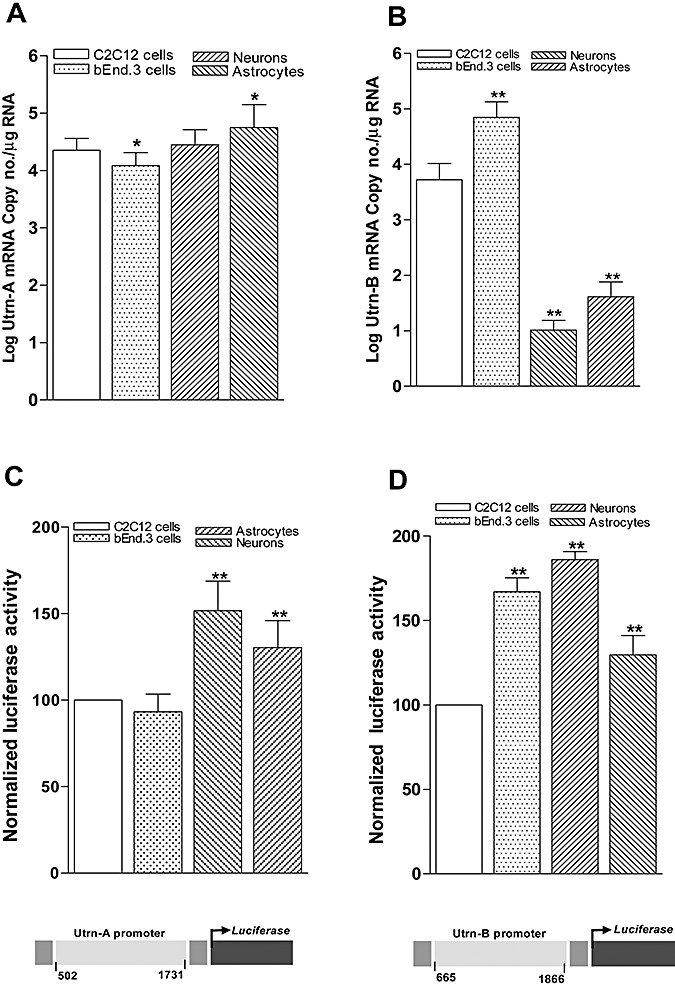
Utrophin (Utrn) is the autosomal homolog of dystrophin, the Duchene Muscular Dystrophy (DMD) locus product and of therapeutic interest, as its overexpression can compensate dystrophin's absence. Utrn is transcribed by Utrn-A and -B promoters with mRNAs differing at their 5' ends. However, previous central nervous system (CNS) studies used C-terminal antibodies recognizing both isoforms. As this distinction may impact upregulation strategies, we generated Utrn-A and -B promoter-specific antibodies, Taqman Polymerase chain reaction (PCR)-based absolute copy number assays, and luciferase-reporter constructs to study CNS of normal and dystrophic mdx mice. Differential expression of Utrn-A and -B was noted in microdissected and capillary-enriched fractions. At the protein level, Utrn-B was predominantly expressed in vasculature and ependymal lining, whereas Utrn-A was expressed in neurons, astrocytes, choroid plexus and pia mater. mRNA quantification demonstrated matching patterns of differential expression; however, transcription-translation mismatch was noted for Utrn-B in caudal brain regions. Utrn-A and Utrn-B proteins were significantly upregulated in olfactory bulb and cerebellum of mdx brain. Differential promoter activity, mRNA and protein expressions were studied in cultured C2C12, bEnd3, neurons and astrocytes. Promoter activity ranking for Utrn-A and -B was neurons > astrocytes > C2C12 > bEnd3 and bEnd3 > astrocytes > neurons > C2C12, respectively. Our results identify promoter usage patterns for therapeutic targeting and define promoter-specific differential distribution of Utrn isoforms in normal and dystrophic CNS.


Figures

Figure 1
Figure 1
Schematic representation of the mouse utrophin gene with unique regions of Utrn‐A and Utrn‐B promoters. A. Alternative utrophin transcripts, including exons 1A and 2A of Utrn‐A, transcribed from the upstream region of the Utrn‐A promoter (light shaded rectangles) and exon 1B (dotted rectangles) of Utrn‐B, transcribed from the downstream region of the Utrn‐B promoter. The unique translated exon of Utrn‐A is 2A, and for the Utrn‐B promoter, exon 1B (exon 1A of Utrn‐A promoter is untranslated). Transcription start sites for Utrn‐A and Utrn‐B transcripts are marked by arrows. Exons 3–75 (darkly shaded rectangles) are common for both Utrn‐A and ‐B, and introns are indicated by empty boxes. B. Schematic of Utrn‐A‐specific primer locations for qPCR (Polymerase chain reaction) assays. Exon 2A (light shaded rectangles) sequence was used to design forward primer F(A) (arrow) and specific TaqMan‐FAM probe (asterisk) to quantify Utrn‐A transcripts. C. Schematic of Utrn‐B‐specific locations for qPCR assays. Exon 1B (dotted rectangles) sequence was used to design the forward primer F[B]; arrow) and specific TaqMan‐FAM probe (asterisk). A common reverse primer was designed using sequences from exon 3 R(A/B) flanking arrows in B and C to quantify both Utrn‐A and ‐B transcripts from total RNA of normal and mdx mouse tissues. D,E. Amino acid sequences of peptides used to generate specific rabbit anti‐Utrn‐A (from exon 2A) and anti‐Utrn‐B (from exon 1B) polyclonal antibodies.
Figure 2
Figure 2
Differential expression pattern of Utrn‐A and Utrn‐B in skeletal muscle. Immunofluorescent labeling of 10‐µm thick frozen sections of mdx mouse tibilais anterior (TA) muscle with A. Utrn‐A antibody (green channel), with neuromuscular junction‐specific marker α‐bungarotoxin (BTX), red channel and co‐localization of Utrn‐A and BTX (merged image). B. Immunolabeling of mdx mouse TA with Utrn‐B antibody (red channel) and co‐labeling with vascular marker, lectin (green channel), and co‐localization of Utrn‐B and lectin labeling at vascular elements (merged image). C. Utrn‐B immunolabeling (green channel) and co‐labeling with endothelial marker CD‐31 (red channel) and co‐localization of Utrn‐B and CD‐31 at the endothelial (luminal) aspects of vascular elements (merged image). Structures marked are a muscle artery (large arrow), arteriole (small arrow) and capillaries (arrow head). D. Higher magnification of rectangular area shown in the merged image of panel C showing co‐labeling of Utrn‐B and CD‐31 along the endothelial cells of the muscular artery (large arrow), arteriole (small arrow) and in the capillaries (arrow head). Scale bar, 50 µm.
Figure 3
Figure 3
Utrn‐A and ‐B are upregulated in dystrophin‐deficient mdx muscles. Confocal immunofluorescent images from 10 µm thick frozen sections of normal and mdx mouse tibialis anterior (TA) muscle and respiratory muscle and diaphragm. Sections were immunolabeled with anti‐Utrn‐A antibody (A,B) and neuromuscular junction‐specific marker α‐BTX (red channel), and merged to reveal areas of co‐localization (merged image). Similarly, TA and diaphragm sections were immunolabeled with anti‐Utrn‐B antibody (C,D) (green channel) and endothelial marker, CD‐31 (BTX, red channel) to reveal co‐labeling. In normal TA and diaphragm muscles, Utrn‐A immunostaining was mainly confined to NMJs, whereas in mdx muscles, immunolabeling was stronger, and it extended along the periphery of the sarcolemma to overtake the missing dystrophin. In normal TA and diaphragm muscles, Utrn‐B immunolabeling was mainly localized in the vascular elements (green channel). Surprisingly, in mdx muscles, Utrn‐B immunolabeling intensity appeared stronger than in normal muscles. Merged image show Utrn‐B immunostaining mainly confined to the endothelial cells of the vascular elements. No significant labeling was noted in sections incubated with corresponding preimmune serum for Utrn‐A and Utrn‐B antibodies. Scale bar, 50 µm.
Figure 4
Figure 4
Quantitation of utrophin transcripts expression in normal and mdx mouse. Utrn‐A and Utrn‐B expression levels in normal and dystrophin‐deficient skeletal muscles (A,B), diaphragm, lungs and heart (C,D) were determined at transcriptional level by an absolute TaqMan‐based qPCR (Polymerase chain reaction) assay for steady‐state mRNA expression. A,B. Comparison of Utrn‐A and ‐B mRNA (log mRNA copy number/µg of total RNA) reveled significantly higher Utrn‐A and ‐B mRNA levels in mdx skeletal muscles (n = 6; **P < 0.001). Similarly, Utrn‐A and ‐B mRNA levels were significantly higher (n = 6; **P < 0.001) in diaphragm, lungs and heart tissues in mdx than normal mouse. Means ± standard deviation (SD) are shown. Among all tissues studied, mouse lung showed the highest level of Utrn‐A mRNA.
Figure 5
Figure 5
Quantitation of utrophin protein expression in normal and mdx mouse. Utrn‐A and Utrn‐B expression levels in normal and dystrophin‐deficient skeletal muscles (A–D), diaphragm, lungs and heart (E,H) were determined at translational level by immunoblotting. Western blot analysis of lysates containing 50 µg of total protein probed with Utrn‐A and ‐B antibodies. Utrn‐A protein was upregulated in mdx skeletal muscles, as shown (A,C). Quantification of Utrn‐A protein levels in normal and mdx muscles, expressed as normalized value of Utrn‐A/tubulin, revealed significant upregulation in tibialis anterior (TA), gastrocnemius (Gastroc) and quadriceps (Quad) muscles of mdx mice (C). Utrn‐B protein upregulation in the Gastroc was equivocal; however, tibialis anterior (TA) and Quad showed significantly higher expression than normal muscles (B). Lower lanes show blots probed with tubulin antibodies. Further, densitometric analysis confirmed significant upregulation of Utrn‐B in TA and Quad (D). Similarly, Utrn‐A and Utrn‐B expression levels in normal and mdx diaphragm (Dia), lungs and heart were determined at the translational levels (E–H). At the protein level, there was strong upregulation of Utrn‐A protein in mdx mouse Dia and heart, while in mouse lung, there was no upregulation of Utrn‐A as expected (E). Quantification of repeated blots of Utrn‐A, expressed as normalized value of Utrn‐A/tubulin, further confirmed significant upregulation of Utrn‐A in mdx Dia and heart (G). Among these tissues studied, Utrn‐B protein was significantly upregulated in lungs and diaphragm, but not in the heart (F). Densitometric analysis confirmed significant upregulation of Utrn‐B in Dia and lungs (H). Lower lanes show blots probed with tubulin antibodies. Histograms show means ± SD. Statistical analysis was conducted using Student's t‐tests. Each blot is a representative immunoblot from minimum of four experiments. *P <0.05; **P < 0.001.
Figure 6
Figure 6
Quantitation of utrophin expression in normal and mdx mouse central nervous system (CNS). A,B. Expression levels of Utrn‐A and Utrn‐B mRNAs in olfactory bulb (OLB), cortex (CTX), hypothalamus (HTH), cerebellum (CBL), brainstem (BST) and the spinal cord (SPC) of normal and mdx mice did not show any significant differences in mdx mice compared with normal mice. Mean ± SD are shown. C,D. Western blot analysis of brain lysates of normal and mdx mouse containing 50 µg of total protein probed with Utrn‐A and Utrn‐B antibodies. Different regions of the CNS showed mild to moderate degree of upregulation in regions studied except for the brain stem (for Utrn‐A) and spinal cord (for Utrn‐B), were levels were similar in normal and mdx mice. Further, densitometric analysis of Utrn‐A (E) and Utrn‐B (F), expressed as normalized value of Utrn‐A/tubulin and Utrn‐B/tubulin respectively, revealed significant upregulation of Utrn‐A in the olfactory bulb, hypothalamus and cerebellum of mdx mouse, while Utrn‐B protein was upregulated only in the olfactory bulb and cerebellum. Histograms show means ± standard deviation. Statistical analysis were conducted using Student's t‐tests. Lower lanes show blots probed with tubulin antibodies. Each blot is a representative immunoblot from minimum of four experiments. *P < 0.05.
Figure 7
Figure 7
Differential expression of Utrn‐A and Utrn‐B in the central nervous system. A. Utrn‐A immunolabeling in the olfactory bulb of mdx mice. Strong staining of Utrn‐A in the neurons of olfactory nerve layer, glomerular layer and isolated neurons in external plexiform layer. Neurons in the mitral cell layer and granule cell layer showed moderate staining of Utrn‐A. Note that apart from neuronal population, fine capillaries also showed Utrn‐A staining in the olfactory bulb. A'. The vascular elements in the olfactory bulb showed strong Utrn‐B immunolabeling (arrows), whereas neurons at different layers showed weak staining of Utrn‐B. B. Utrn‐A immunolabeling profiles in the parietal cortex, primarily pyramidal neurons in layers II, III and IV. B'. Similar region from adjacent section show moderate Utrn‐B immunolabeling in the cortical neurons in layers II, III and IV. Note small muscular arteries showing Utrn‐B staining along the pia and in the brain parenchyma (arrow). Such vascular elements unavoidably contribute to Utrn‐B derived from various brain regions. C. Rostral hypothalamus expressed strong Utrn‐A immunolabeling in neurons. C'. Utrn‐B staining was moderate in neurons in the rostral hypothalamus; however, vascular elements were strongly positive. Note strongly positive fine blood vessel along the optic nerve (arrow). D. Median eminence (ME) shows strong Utrn‐A immunolabeling. Note strong staining along outer layer of the ME (arrows). D'. Utrn‐B immunolabeling was only restricted to the outer surface of the ME (arrows). E. Intense Utrn‐A labeling in hippocampus at CA3 region. Also note that intermediate neurons, muscular artery (arrow) and fine capillaries are positive for Utrn‐A. E'. Adjacent section reacted with Utrn‐B antibody showing strong labeling in muscular artery (arrow) and moderate labeling in fine capillaries. Neurons were weakly positive for Utrn‐B. F. Utrn‐A immunolabeling in Purkinje cell bodies, and granular cells in the cerebellum. In the molecular layer of cerebellum, vascular elements were moderately positive for Utrn‐A. F'. Utrn‐B immunolabeling was limited to the vascular elements in the cerebellum (arrows). G. In the medullary region, neurons and capillaries showed strong Utrn‐A immunolabeling. G'. Adjacent section that reacted for Utrn‐B showed strong immunolabeling in capillaries (arrows) and moderately positive neurons. H. Rostral spinal cord showing strong Utrn‐A immunolabeling in neurons and vascular elements. H'. A weak labeling of Utrn‐B was observed in neurons and blood vessels at the rostral spinal cord. Scale bar, 50 µm. Abbreviations: CC = central canal; gcl = granular cell layer; mol = molecular cell layer; pcl = Purkinje cell layer.
Figure 8
Figure 8
Immunolocalization of Utrn‐A and ‐B in mdx mouse brain. Using confocal miscroscopy, double‐labeled sections of the central nervous system, passing through the olfactory bulb, cerebral cortex, hippocampus, caudal diencephalon at the level of subcommissural organ (SCO) and the spinal cord, were studied for understanding the cellular distribution of Utrn‐A (column A) and Utrn‐B (column B) (green channel). A neuronal marker, antimouse NeuN, was used to counter stain neurons (red channel). Merged channels show extent of colocalization. A. Utrn‐A labeling was noted in the olfactory bulb. In cerebral cortex, strong staining of Utrn‐A was found in neurons of II–VI layers. The hippocampal pyramidal cell layer of CA1–CA3 areas and dentate gyrus (DG) showed strong Utrn‐A staining. The epithelial cells in the SCO express strong Utrn‐A labeling (arrows). Strong Utrn‐A immunolabeling was observed in neurons of the spinal cord. B. Utrn‐B immunolabeling was weak in neurons of the olfactory bulb, cerebral cortex, hippocampus, caudal diencephalon and the spinal cord; only the vascular elements showed strong Utrn‐B immunolabeling. A moderate degree of Utrn‐B labeling was observed in the SCO (arrows). Scale bar, 50 µm. Abbreviations: ONL = olfactory nerve layer; GL = glomerular layer; EPL = external plexiform layer; MCL = mitral cell layer; IPL = internal plexiform layer; GCL = granule layer; DG = dentate gyrus; PCO = posterior commissure; V = ventricle.
Figure 9
Figure 9
Differential expression of Utrn‐A and ‐B in choroid plexus and vascular elements. A. Expression pattern of Utrn‐A transcript was quantified in microdissected choroid plexus, central nervous system (CNS) blood vessels and fractionated capillaries. Utrn‐A transcript expression was significantly higher in choroid plexus than in blood vessels and capillaries (n = 6; **P < 0.001). Compared with blood vessels, transcript level was significantly higher in capillaries (n = 6; *P < 0.01). B. CNS capillaries showed significantly higher Utrn‐B mRNA (n = 6; **P < 0.001) than choroid plexus and blood vessels. Mean ± standard deviation (SD) are shown. C,C'. Immunolabeling of transverse section of mdx brain at the level of choroid plexus showed strong Utrn‐A immunolabeling; however, adjacent section labeled with Utrn‐B shows weak labeling in the choroid plexus. The ependymal lining and vascular elements show strong immunolabeling with both antibodies. D,D'. Higher magnification of the choroid plexus from dystrophic mouse immunolabeled with anti‐Utrn‐A (D) and anti‐Utrn‐B antibodies (D'). Strong immunolabeling of Utrn‐A along the basal membrane (arrows) and weak staining at the epithelial cells (arrow heads). Choroid plexus show weak Utrn‐B immunolabeling, which may contribute to the high vascular contents, whereas choroid epithelial cells (arrowheads) did not show Utrn‐B immunolabeling in dystrophic mice. E,E'. A blood vessel along ventral region of brain demonstrates no significant Utrn‐A labeling, whereas ependymal lining, perivascular astrocytes and neurons show moderate Utrn‐A labeling. Adjacent section reacted with Utrn‐B antibodies, showing strong immunolabeling in the blood vessels. Also note moderate staining along the ependymal lining and vascular elements. F,F'. Higher magnification of a blood vessel show Utrn‐A labeling of perivascular astrocytes making close contact with blood vessels; however, adjacent section reacted with Utrn‐B label the blood vessels rather than perivascular astrocytes. Note that moderate labeling of neurons is also visualized. G,H. Western blot analysis of lysates containing 50 µg of total protein probed with Utrn‐A and ‐B antibodies. G. Consistent with immunolabeling, Utrn‐A is expressed at high levels in choroid plexus compared with capillaries and blood vessels. H. Differential expression of Utrn‐B protein in choroid plexus, blood vessels and capillaries. Among these structures studied, Utrn‐B protein was abundant in brain capillaries as compared with blood vessels and choroid plexus. Histograms show means ± SD. Representative blots from a minimum of five experiments. Lower lanes show blots probed with tubulin antibodies. I,J. Histogram of densitometric quantification of Utrn‐A and Utrn‐B proteins in choroid plexus, blood vessels and brain capillaries normalized by corresponding tubulin bands, respectively showing significantly higher amount of Utrn‐A in choroid plexus than brain vascular elements, whereas Utrn‐B was significantly higher in brain capillaries compared with choroid plexus and blood vessels. Compared with Utrn‐A and Utrn‐B protein levels in the choroid plexus; statistical analysis was performed by one‐way analysis of variance (n = 6; *P < 0.05, **P < 0.001). Scale bar, 50 µm.
Figure 10
Figure 10
Utrn‐A and ‐B expression in different cellular components of the central nervous system. C2C12 cells, bEnd.3 cells, primary neurons and astrocytes cultures were used to study differential expression of Utrn‐A and ‐B proteins. A. C2C12 cells, primary mdx neurons and astrocytes showed greater Utrn‐A immunolabeling than Utrn‐B. C2C12 cells were colabeled with desmin, bEnd.3 cells, endothelial cell marker, CD31, neurons co‐labeled with the neuronal cell marker, NeuN, astrocytes colabeled with S100. B,D. Western blot analysis of lysates containing 50 µg of total protein probed with Utrn‐A and ‐B antibodies. Consistent with immunolabeling, Utrn‐A expression was higher in neurons and bEnd.3 cells compared with C2C12 cells and astrocytes. However, Utrn‐B protein expression was greater in bEnd.3 cells compared with other cell types. Expression of Utrn‐B in C2C12 cells was extremely low. Representative blots from a minimum of 5 experiments. Lower lanes show blots probed with tubulin antibodies. C,E. Histogram of densitometric quantification of Utrn‐A and Utrn‐B proteins in various cell types corrected by the corresponding tubulin bands, respectively. Compared with Utrn‐A and Utrn‐B protein levels in the C2C12 cells; statistical analysis was performed by one‐way analysis of variance (n = 6; *P < 0.05, **P < 0.001). Means are presented as ± SD. Scale bar, 100 µm.
Figure 11
Figure 11
Differential regulation of Utrn‐A and Utrn‐B promoters in the central nervous system. Expression pattern of Utrn‐A and Utrn‐B transcripts (A,B) and endogenous promoter activity (C,D) was studied in primary cultures of neurons and astroglia isolated from mdx mouse brain, C2C12 and bEnd.3 cell lines. A,B. Utrn‐A transcript level was significantly higher (n = 6; *P < 0.05) in astrocytes and neurons compared with C2C12, whereas in bEnd.3 cells Utrn‐A mRNA was significantly lower (n = 6; *P < 0.05). Utrn‐B mRNA expression was significantly (n = 6; **P < 0.001) higher in bEnd.3 cells, whereas neurons and astrocytes showed significantly (n = 6; **P < 0.001) lower amount of Utrn‐B mRNA compared with C2C12 cells. Mean ± SD are shown. Statistical analysis was conducted using Student's t‐tests. C,D. Differential expression of endogenous Utrn‐A and Utrn‐B promoter activity. Primary neurons, astrocytes, C2C12 cell and bEnd.3 cell cultures were transfected with utrophin‐A (mUtrn‐A‐luc) and/or Utrn‐B (mUtrn‐B‐luc) reporter constructs, along with transfection control pRL‐TK. Promoter activity was assayed 24 h after trasnfection. Endogenous Utrn‐A promoter activity was the greatest in neurons and significantly higher than astrocytes compared with C2C12 cells or bEnd.3 cells. Endogenous Utrn‐B promoter activity was highest in bEnd.3 cells, and significantly high in neurons and astrocytes compared with C2C12 cells. Utrn‐A or Utrn‐B‐derived firefly luciferase activities were normalized to pRL‐TK‐derived renilla luciferase activity (internal control) and expressed as 100% to C2C12 cells. Normalized luciferase values are mean values of 6 wells in three separate experiments. Mean ± SD is shown. Statistical analysis was conducted using Student's t‐tests. Schematic representations of mouse utrophin promoters are shown. Schematic representation of regions of mouse Utrn‐A and Utrn‐B promoter cloned to generate luciferase reporter constructs is given further.

Similar articles

Cited by

References

    1. Amiry‐Moghaddam M, Williamson A, Palomba M, Eid T, De Lanerolle NC, Nagelhus EA et al (2003) Delayed k+ clearance associated with aquaporin‐4 mislocalization: phenotypic defects in brains of alpha‐syntrophin‐null mice. Proc Natl Acad Sci U S A 100:13615–13620. - PMC - PubMed
    1. Atherton GW, Cabric M, James NT (1982) Stereological analyses of capillaries in muscles of dystrophic mice. Virchows Arch A Pathol Anat Histol 397:347–354. - PubMed
    1. Blake DJ, Hawkes R, Benson MA, Beesley PW (1999) Different dystrophin‐like complexes are expressed in neurons and glia. J Cell Biol 147:645–658. - PMC - PubMed
    1. Burton EA, Tinsley JM, Holzfeind PJ, Rodrigues NR, Davies KE (1999) A second promoter provides an alternative target for therapeutic up‐regulation of utrophin in Duchenne muscular dystrophy. Proc Natl Acad Sci USA 96:14025–14030. - PMC - PubMed
    1. Campbell KP (1995) Three muscular dystrophies: loss of cytoskeleton‐extracellular matrix linkage. Cell 80:675–679. - PubMed

Publication types

MeSH terms