

3-O-methylfunicone, a metabolite of Penicillium pinophilum, inhibits proliferation of human melanoma cells by causing G(2) + M arrest and inducing apoptosis
- PMID: 19486013
- PMCID: PMC6495934
- DOI: 10.1111/j.1365-2184.2009.00609.x
3-O-methylfunicone, a metabolite of Penicillium pinophilum, inhibits proliferation of human melanoma cells by causing G(2) + M arrest and inducing apoptosis
Abstract
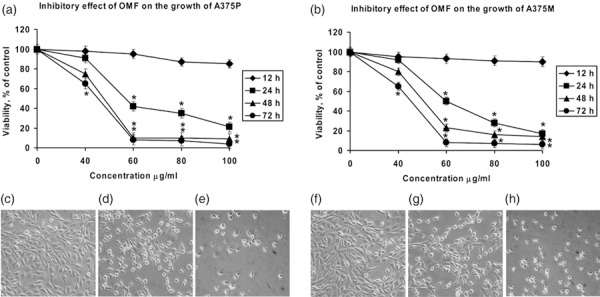
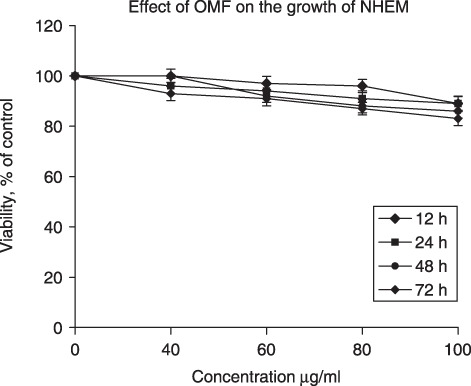
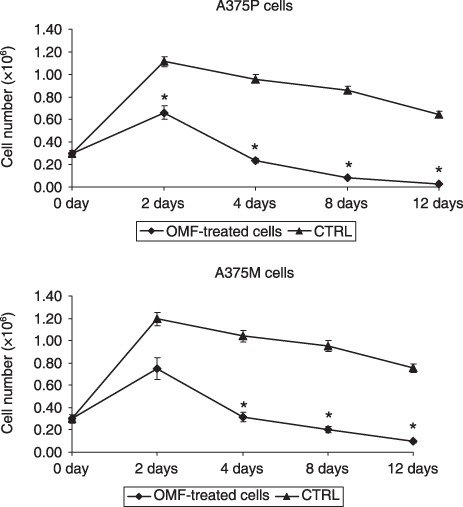
Objectives: Melanoma cells take advantage of impaired ability to undergo programmed cell death in response to different external stimuli and chemotherapeutic drugs; this makes prevention of tumour progression very difficult. The aim of this study was to demonstrate whether 3-O-methylfunicone (OMF), a metabolite of Penicillium pinophilum, has the ability to arrest cell population growth and to induce apoptosis in A375P (parental) and A375M (metastasis derivatived) melanoma cell lines.
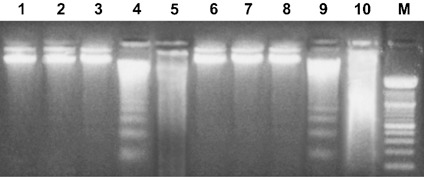
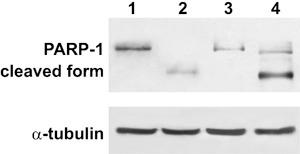
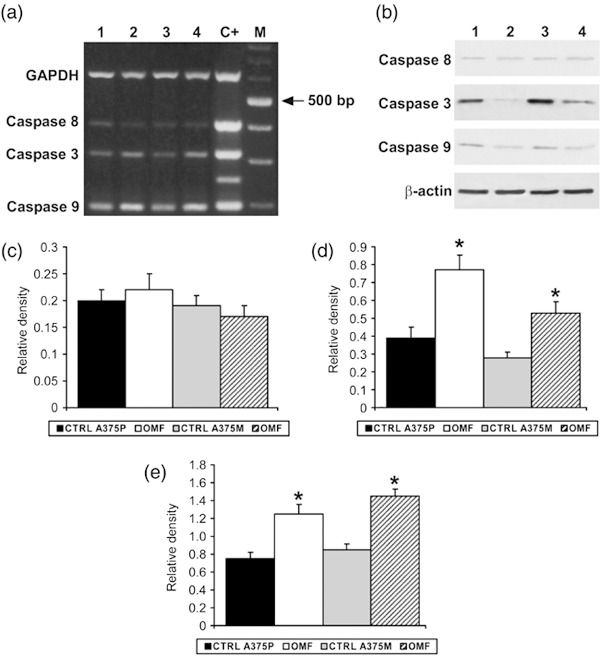
Materials and methods: Cell proliferation and apoptosis were analysed by flow cytometry, DNA fragmentation, caspase-3 and caspase-9 activation, and PARP-1 cleavage.
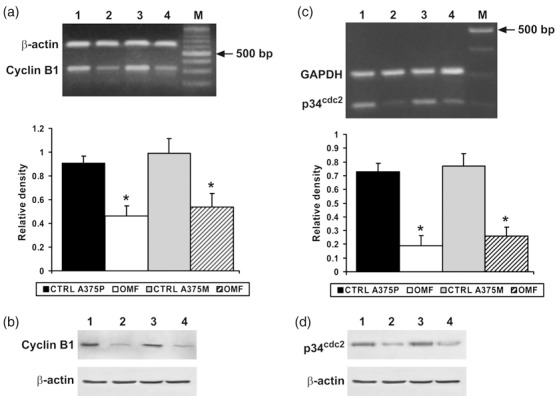
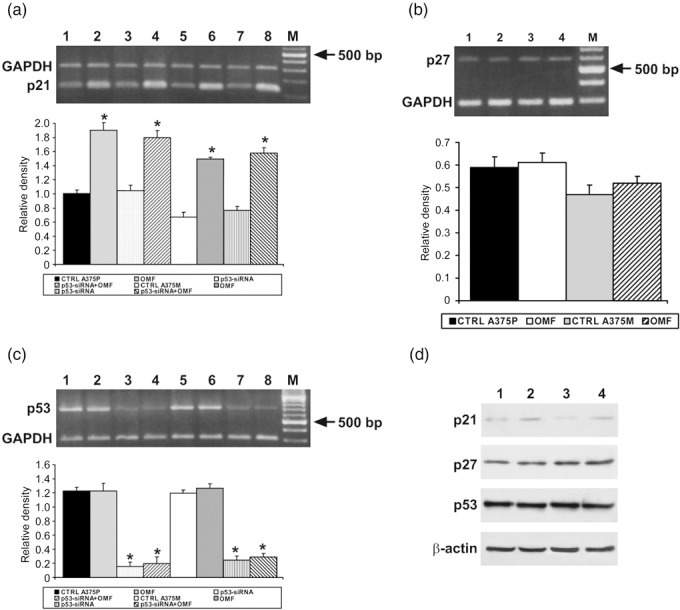
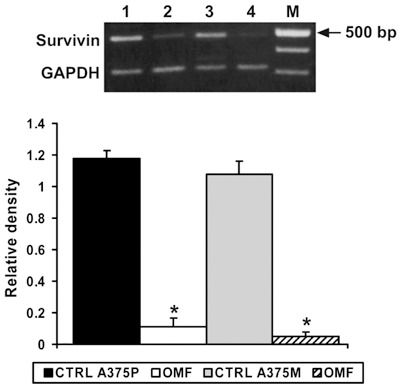
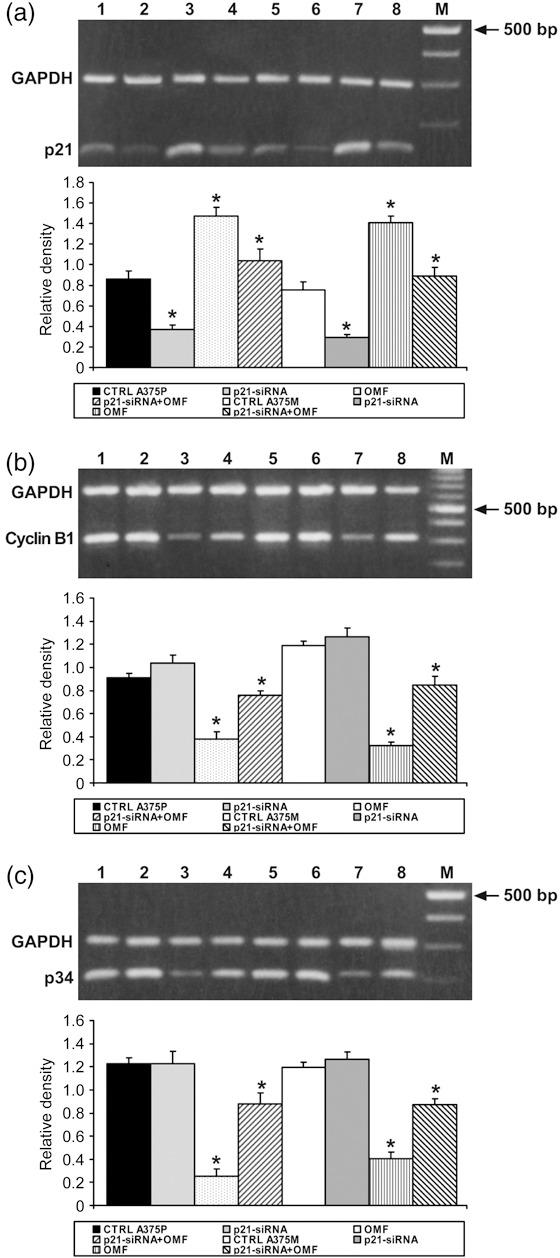
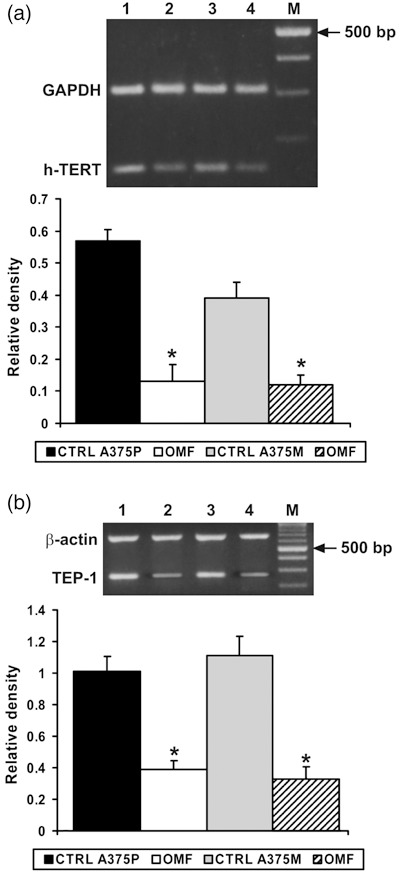
Results: We demonstrated that OMF affected cell proliferation in a time- and dose-dependent manner, reaching the best effect at concentration of 80 microg/ml for 24 h. Flow cytometry revealed that OMF caused significant G(2) phase arrest, which was associated with marked decrease in cyclin B1/p34(cdc2) complex and p21 induction. OMF also induced marked decrease of survivin expression. Reduced levels of apoptosis were evident after silencing p21 expression in both cell lines. Finally, the effect exercised by OMF on hTERT and TEP-1 gene expression confirmed the ability of this molecule to interfere with replicative ability of cells.
Conclusions: The results reported here seem to suggest that OMF as a promising molecule to include in strategies for treatment of melanoma.
Figures
Similar articles
-
3-O-methylfunicone, from Penicillium pinophilum, is a selective inhibitor of breast cancer stem cells.Cell Prolif. 2011 Oct;44(5):401-9. doi: 10.1111/j.1365-2184.2011.00766.x. Cell Prolif. 2011. PMID: 21951283 Free PMC article.
-
3-O-methylfunicone, a secondary metabolite produced by Penicillium pinophilum, induces growth arrest and apoptosis in HeLa cells.Cell Prolif. 2004 Dec;37(6):413-26. doi: 10.1111/j.1365-2184.2004.00323.x. Cell Prolif. 2004. PMID: 15548174 Free PMC article.
-
Cell-growth and migration inhibition of human mesothelioma cells induced by 3-O-methylfunicone from Penicillium pinophilum and cisplatin.Invest New Drugs. 2012 Aug;30(4):1343-51. doi: 10.1007/s10637-011-9698-1. Epub 2011 Jun 9. Invest New Drugs. 2012. PMID: 21656164
-
3-O-methylfunicone produced by penicillium pinophilum affects cell motility of breast cancer cells, downregulating alphavbeta5 integrin and inhibiting metalloproteinase-9 secretion.Mol Carcinog. 2007 Nov;46(11):930-40. doi: 10.1002/mc.20322. Mol Carcinog. 2007. PMID: 17562555
-
3-O-Methylfunicone, a metabolite produced by Penicillium pinophilum, modulates ERK1/2 activity, affecting cell motility of human mesothelioma cells.Cell Prolif. 2010 Apr;43(2):114-23. doi: 10.1111/j.1365-2184.2010.00663.x. Cell Prolif. 2010. PMID: 20447056 Free PMC article.
Cited by
-
The Outstanding Chemodiversity of Marine-Derived Talaromyces.Biomolecules. 2023 Jun 21;13(7):1021. doi: 10.3390/biom13071021. Biomolecules. 2023. PMID: 37509057 Free PMC article. Review.
-
Diversity of leaf endophytic fungi in mangrove plants of northeast Brazil.Braz J Microbiol. 2012 Jul;43(3):1165-73. doi: 10.1590/S1517-838220120003000044. Epub 2012 Jun 1. Braz J Microbiol. 2012. PMID: 24031941 Free PMC article.
-
Occurence and bioactivities of funicone-related compounds.Int J Mol Sci. 2009 Mar 30;10(4):1430-1444. doi: 10.3390/ijms10041430. Int J Mol Sci. 2009. PMID: 19468317 Free PMC article. Review.
-
Antiviral Property of the Fungal Metabolite 3-O-Methylfunicone in Bovine Herpesvirus 1 Infection.Microorganisms. 2022 Jan 15;10(1):188. doi: 10.3390/microorganisms10010188. Microorganisms. 2022. PMID: 35056637 Free PMC article.
-
Talarodiolide, a New 12-Membered Macrodiolide, and GC/MS Investigation of Culture Filtrate and Mycelial Extracts of Talaromyces pinophilus.Molecules. 2018 Apr 19;23(4):950. doi: 10.3390/molecules23040950. Molecules. 2018. PMID: 29671776 Free PMC article.
References
-
- Soengas MS, Lowe SW (2003) Apoptosis and melanoma chemoresistance. Oncogene 22, 3138–3151. - PubMed
-
- Balch CM, Buzaid AC, Soong SJ, Atkins MB, Cascinelli N, Coit DG et al (2001) Final version of the American Joint Committee on Cancer staging system for cutaneous melanoma. J. Clin. Invest. 19, 3635–3648. - PubMed
-
- Glinsky GV, Glinsky VV, Ivanova AB, Hueser CJ (1997) Apoptosis and metastasis: increased apoptosis resistance of metastatic cancer cells is associated with the profound deficiency of apoptosis execution mechanism. Cancer Lett. 115, 185–193. - PubMed
-
- Johnstone RW, Ruefli AA, Lowe SW (2002) Apoptosis: a link between cancer genetics and chemiotherapy. Cell 108, 153–164. - PubMed
-
- Bowen AR, Hanks AN, Allen SM, Alexander A, Diedrich MJ, Grossman D (2003) Apoptosis regulators and responses in human melanocytic and keratinocytic cells. J. Invest. Dermatol. 120, 48–55. - PubMed
Publication types
MeSH terms
Substances
LinkOut - more resources
Full Text Sources
Medical
Research Materials
Miscellaneous
