. 2009 Jun 2:10:55.
doi: 10.1186/1471-2202-10-55.

Symbiotic relationship between brain structure and dynamics

Affiliations

Symbiotic relationship between brain structure and dynamics

Mikail Rubinov et al. BMC Neurosci. .

Abstract

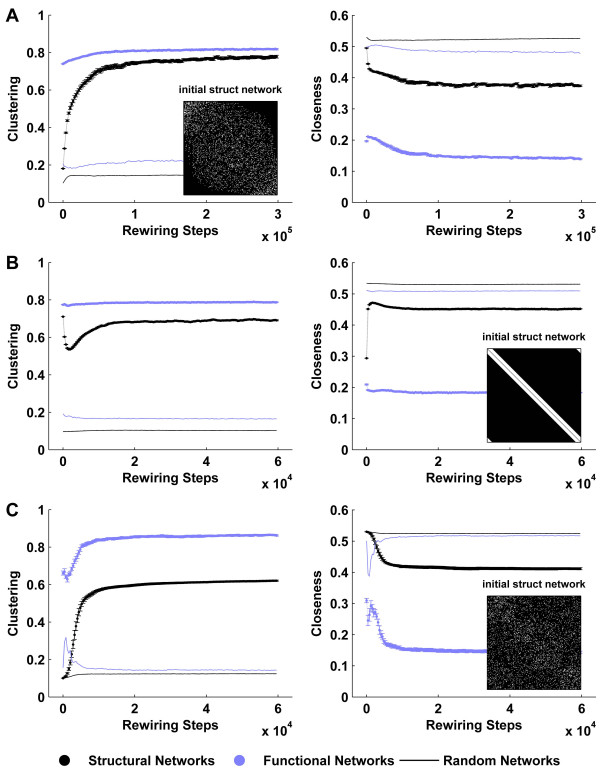
Background: Brain structure and dynamics are interdependent through processes such as activity-dependent neuroplasticity. In this study, we aim to theoretically examine this interdependence in a model of spontaneous cortical activity. To this end, we simulate spontaneous brain dynamics on structural connectivity networks, using coupled nonlinear maps. On slow time scales structural connectivity is gradually adjusted towards the resulting functional patterns via an unsupervised, activity-dependent rewiring rule. The present model has been previously shown to generate cortical-like, modular small-world structural topology from initially random connectivity. We provide further biophysical justification for this model and quantitatively characterize the relationship between structure, function and dynamics that accompanies the ensuing self-organization.

Results: We show that coupled chaotic dynamics generate ordered and modular functional patterns, even on a random underlying structural connectivity. Consequently, structural connectivity becomes more modular as it rewires towards these functional patterns. Functional networks reflect the underlying structural networks on slow time scales, but significantly less so on faster time scales. In spite of ordered functional topology, structural networks remain robustly interconnected--and therefore small-world--due to the presence of central, inter-modular hub nodes. The noisy dynamics of these hubs enable them to persist despite ongoing rewiring and despite their comparative absence in functional networks.

Conclusion: Our results outline a theoretical mechanism by which brain dynamics may facilitate neuroanatomical self-organization. We find time scale dependent differences between structural and functional networks. These differences are likely to arise from the distinct dynamics of central structural nodes.


Figures

Figure 1
Figure 1
Functional connectivity of simulated neural mass model dynamics on a random structural network. (A). The underlying 256 node random structural network. Here and in the following figures, networks are represented by their square connectivity matrices, where row and column indices correspond to nodes, and matrix entries correspond to connections between individual nodes. (B). The emergent spatiotemporal dynamics: color represents the state of individual dynamical units according to space (horizontal axis) and time (vertical axis). (C). The resulting functional connectivity matrix, derived by linear cross-correlation between the spatiotemporal dynamics from B and reordered to maximize the visual appearance of modules (this reordering was also applied to A, with negligible impact). Each dynamical unit represents the mean state of a local population of densely connected inhibitory and pyramidal neurons, with conductance-based transmembrane ion flows and zero-order synaptic kinetics. Full details of these dynamics are provided in Breakspear et al. [33].
Figure 2
Figure 2
Dimension reduction of nonlinear neuronal dynamics. (A). Phase space attractor of a three-dimensional neural mass flow. This attractor is an illustration of the dynamics generated by the flow of a neural mass model (see Breakspear et al. [33]). The dynamical variables represent the mean membrane potential of pyramidal (V) and inhibitory (Z) neurons, and the average number of open potassium ion channels (W). (B). Poincaré first return map from the same attractor [33]; this map captures key features of the neural mass flow, by following each trajectory from one intersection (V) of the attractor to the next (P(V)). (C). The quadratic logistic map. This map has the same unimodal topology as the neural mass Poincaré return map. While the logistic map lacks the "thickness" of the neural mass map, it is several orders of magnitude faster to compute, hence allowing the detailed quantitative analysis in the present paper.
Figure 3
Figure 3
Interdependent evolution of structural and functional networks. Concurrent evolution of clustering (A), closeness (B) and modularity (C) of structural (black) and functional (blue) networks. Metrics derived from surrogate random networks (solid lines) are plotted for comparison. (D) Median, minimum and maximum rewiring rates at each rewiring step. While some nodes cease rewiring at the asymptotic state, others remain highly rewirable – hence rewiring is ongoing despite a stable structural topology. Error bars represent the standard error of the mean, as estimated over 20 simulations.
Figure 4
Figure 4
Characteristic structural and functional networks at different phases in the evolution. The initial (row 1), evolving (row 2) and asymptotic (row 3) network configurations are illustrated for structural (column 1), fast time scale (column 2) and slow time scale functional (column 3) networks. Fast time scale networks represent the instantaneous patterns of dynamical synchrony, measured as the Euclidean distance between individual unit states. Slow time scale networks are derived by calculating the correlation coefficient of 100 consecutive functional states. Nodes in all networks are reordered to maximize the appearance of modules, via the maximization of modularity (see Methods). Consequently, a network may be reordered differently, at different times in its evolution. However, given the similarity between structural and slow time scale functional networks, pairs (D)-(F) and (G)-(I) have exactly the same ordering in the current figure.
Figure 5
Figure 5
Robustness of structural self-organization. Temporal evolution of clustering and closeness of structural (black) and functional (blue) networks. (A) Evolution under spatial constraints (nodes are placed randomly on a three-dimensional sphere). (B) Evolution from an initial lattice structural topology. (C) Evolution under memory guided rewiring. Insets show initial structural connectivity matrices. Compared to Figure 3, the onset of a small-world topology is faster in (B) and (C) (note the difference in time scale). Metrics derived from surrogate random networks (solid lines) are plotted for comparison. Error bars represent the standard error of the mean, as estimated over 20 simulations.
Figure 6
Figure 6
Dependence of structural evolution on parameters. Asymptotic values for structural clustering (A) and closeness (B), observed for a range of values of the control parameter μ, and coupling strength ε. Each matrix entry corresponds to the average asymptotic structural clustering or closeness for the corresponding parameter values. For example, asymptotic structural values from Figure 3A (≈ 0.7) and Figure 3B (≈ 0.45) are displayed under entries (μ = 1.7, ε = 0.5). Values of the control parameter at 1.4 and below correspond to periodic dynamics, and at 1.5 and above to chaotic dynamics. Evolution to a small-world network occurs under chaotic dynamics with moderate coupling. Values of clustering and closeness represent averages over 25 simulations of 500000 rewiring steps each.
Figure 7
Figure 7
Correlation between structural and functional network metrics. Temporal evolution of the correlation coefficient between structural and functional networks (A), as well between node-wise structural and functional clustering (B) and closeness (C), with illustrative scatter plots (insets) at specified time instants. Functional network metrics are derived by analyzing fast time scale functional networks and averaging the resulting metrics (see main text for details). An alternative approach, which averages the correlations of fast time scale networks, results in significantly weaker correlations (solid lines). (C) Correlation between structural and functional clustering at a single structural state, plotted against the number of sampled instantaneous functional networks. A strong correlation emerges as more networks are sampled. Error bars represent the standard error of the mean, as estimated over 20 simulations.
Figure 8
Figure 8
Correlation between centrality, dynamics and rewiring. Temporal evolution of the correlation between participation and Lyapunov exponent (A), fractal dimension (B), rewiring rate (C), and the likelihood of losing or gaining a link to a rewirable node (D). Scatter plots illustrate typical correlations at the asymptotic state. Participation is a measure of centrality, sensitive for nodes with connections distributed over multiple modules. Note that participation is unreliable at the early stages of evolution, given the weakly modular nature of structural networks. Error bars represent the standard error of the mean, as estimated over 20 simulations.
Figure 9
Figure 9
Fluctuation of structural centrality metrics at the asymptotic phase. (A) Node-wise autocorrelation of clustering, participation and betweenness at the asymptotic phase as a function of progressive rewiring. Error bars represent the standard error of the mean, as estimated over 20 simulations. (B-D) An illustration of the rapid fluctuations in clustering (B), participation (C) and betweenness (D). Note the shorter time scale, compared to (A). Nodes were rank-ordered by centrality (from lowest to highest) at each rewiring step. Color corresponds to the rank-ordering position at the first sampled rewiring step.
Figure 10
Figure 10
Maps of four representative nodes. (A) Low-dimensional chaotic dynamics of a peripheral node, (B) Stochastic high-dimensional cloud of a highly participating hub, (C) An intermediate node, whose dynamics resemble the Poincaré first return map of the neural mass model in Figure 2B, (D) Contracting dynamics of a periodic-like node, perturbed by unsynchronized inputs.

References

    1. Watts DJ, Strogatz SH. Collective dynamics of 'small-world' networks. Nature. 1998;393:440–442. doi: 10.1038/30918. - DOI - PubMed
    1. Humphries MD, Gurney K, Prescott TJ. The brainstem reticular formation is a small-world, not scale-free, network. Proc Biol Sci. 2006;22:503–511. doi: 10.1098/rspb.2005.3354. - DOI - PMC - PubMed
    1. Sporns O, Zwi JD. The Small World of the Cerebral Cortex. Neuroinformatics. 2004;2:145–162. doi: 10.1385/NI:2:2:145. - DOI - PubMed
    1. Hilgetag C, Kaiser M. Clustered Organization of Cortical Connectivity. Neuroinformatics. 2004;2:353–60. doi: 10.1385/NI:2:3:353. - DOI - PubMed
    1. He Y, Chen ZJ, Evans AC. Small-World Anatomical Networks in the Human Brain Revealed by Cortical Thickness from MRI. Cereb Cortex. 2007;17:2407–19. doi: 10.1093/cercor/bhl149. - DOI - PubMed

Publication types