

"Shock and kill" effects of class I-selective histone deacetylase inhibitors in combination with the glutathione synthesis inhibitor buthionine sulfoximine in cell line models for HIV-1 quiescence
- PMID: 19486542
- PMCID: PMC2697151
- DOI: 10.1186/1742-4690-6-52
"Shock and kill" effects of class I-selective histone deacetylase inhibitors in combination with the glutathione synthesis inhibitor buthionine sulfoximine in cell line models for HIV-1 quiescence
Abstract
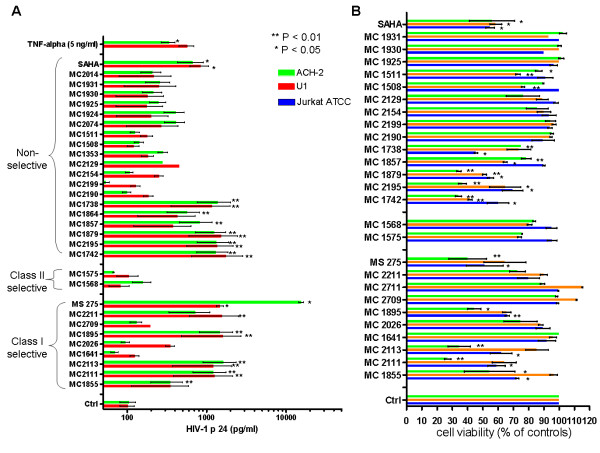
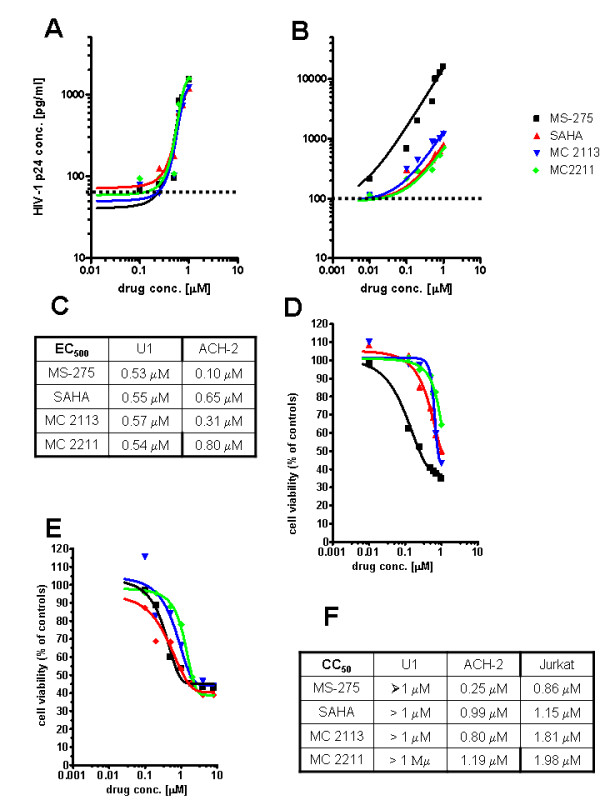
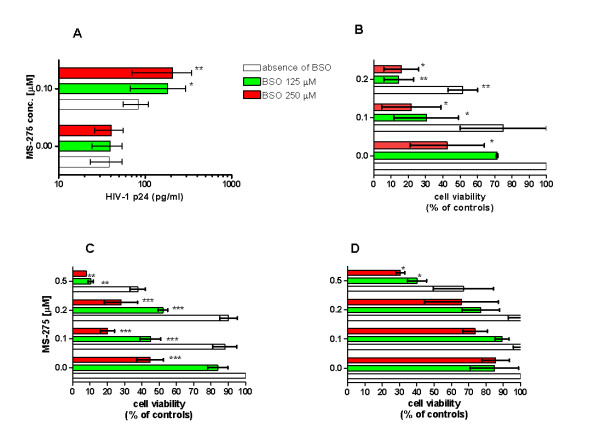
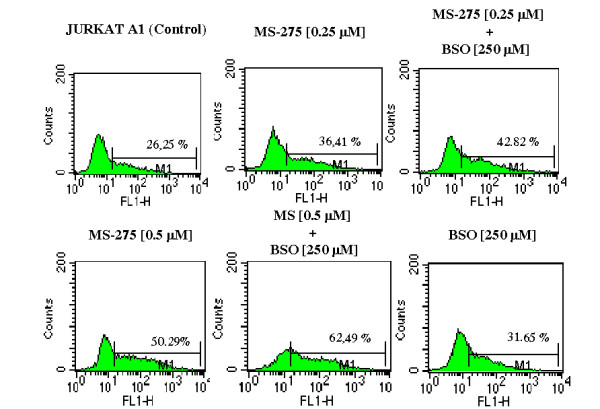
Latently infected, resting memory CD4+ T cells and macrophages represent a major obstacle to the eradication of HIV-1. For this purpose, "shock and kill" strategies have been proposed (activation of HIV-1 followed by stimuli leading to cell death). Histone deacetylase inhibitors (HDACIs) induce HIV-1 activation from quiescence, yet class/isoform-selective HDACIs are needed to specifically target HIV-1 latency. We tested 32 small molecule HDACIs for their ability to induce HIV-1 activation in the ACH-2 and U1 cell line models. In general, potent activators of HIV-1 replication were found among non-class selective and class I-selective HDACIs. However, class I selectivity did not reduce the toxicity of most of the molecules for uninfected cells, which is a major concern for possible HDACI-based therapies. To overcome this problem, complementary strategies using lower HDACI concentrations have been explored. We added to class I HDACIs the glutathione-synthesis inhibitor buthionine sulfoximine (BSO), in an attempt to create an intracellular environment that would facilitate HIV-1 activation. The basis for this strategy was that HIV-1 replication decreases the intracellular levels of reduced glutathione, creating a pro-oxidant environment which in turn stimulates HIV-1 transcription. We found that BSO increased the ability of class I HDACIs to activate HIV-1. This interaction allowed the use of both types of drugs at concentrations that were non-toxic for uninfected cells, whereas the infected cell cultures succumbed more readily to the drug combination. These effects were associated with BSO-induced recruitment of HDACI-insensitive cells into the responding cell population, as shown in Jurkat cell models for HIV-1 quiescence. The results of the present study may contribute to the future design of class I HDACIs for treating HIV-1. Moreover, the combined effects of class I-selective HDACIs and the glutathione synthesis inhibitor BSO suggest the existence of an Achilles' heel that could be manipulated in order to facilitate the "kill" phase of experimental HIV-1 eradication strategies.
Figures
Similar articles
-
In Vitro Reactivation of Replication-Competent and Infectious HIV-1 by Histone Deacetylase Inhibitors.J Virol. 2015 Dec 9;90(4):1858-71. doi: 10.1128/JVI.02359-15. Print 2016 Feb 15. J Virol. 2015. PMID: 26656693 Free PMC article.
-
Histone deacetylase inhibitors induce complex host responses that contribute to differential potencies of these compounds in HIV reactivation.J Biol Chem. 2019 Apr 5;294(14):5576-5589. doi: 10.1074/jbc.RA118.005185. Epub 2019 Feb 11. J Biol Chem. 2019. PMID: 30745362 Free PMC article.
-
Synergistic activation of HIV-1 expression by deacetylase inhibitors and prostratin: implications for treatment of latent infection.PLoS One. 2009 Jun 30;4(6):e6093. doi: 10.1371/journal.pone.0006093. PLoS One. 2009. PMID: 19564922 Free PMC article.
-
Isoform-Selective Versus Nonselective Histone Deacetylase Inhibitors in HIV Latency Reversal.AIDS Res Hum Retroviruses. 2022 Aug;38(8):615-621. doi: 10.1089/AID.2021.0195. AIDS Res Hum Retroviruses. 2022. PMID: 35778852 Free PMC article. Review.
-
The development of immune-modulating compounds to disrupt HIV latency.Cytokine Growth Factor Rev. 2012 Aug-Oct;23(4-5):159-72. doi: 10.1016/j.cytogfr.2012.05.003. Epub 2012 Jul 4. Cytokine Growth Factor Rev. 2012. PMID: 22766356 Review.
Cited by
-
Selective histonedeacetylase inhibitor M344 intervenes in HIV-1 latency through increasing histone acetylation and activation of NF-kappaB.PLoS One. 2012;7(11):e48832. doi: 10.1371/journal.pone.0048832. Epub 2012 Nov 15. PLoS One. 2012. PMID: 23166597 Free PMC article.
-
Inhibitors of histone deacetylases: correlation between isoform specificity and reactivation of HIV type 1 (HIV-1) from latently infected cells.J Biol Chem. 2011 Jun 24;286(25):22211-8. doi: 10.1074/jbc.M110.180224. Epub 2011 Apr 29. J Biol Chem. 2011. PMID: 21531716 Free PMC article.
-
Human CD4+ T cells require exogenous cystine for glutathione and DNA synthesis.Oncotarget. 2015 Sep 8;6(26):21853-64. doi: 10.18632/oncotarget.5213. Oncotarget. 2015. PMID: 26392411 Free PMC article.
-
Global Promoter Targeting of a Conserved Lysine Deacetylase for Transcriptional Shutoff during Quiescence Entry.Mol Cell. 2015 Sep 3;59(5):732-43. doi: 10.1016/j.molcel.2015.07.014. Epub 2015 Aug 20. Mol Cell. 2015. PMID: 26300265 Free PMC article.
-
HIV reservoirs in vivo and new strategies for possible eradication of HIV from the reservoir sites.HIV AIDS (Auckl). 2010;2:103-22. doi: 10.2147/hiv.s6882. Epub 2010 Jun 15. HIV AIDS (Auckl). 2010. PMID: 22096389 Free PMC article.
References
MeSH terms
Substances
LinkOut - more resources
Full Text Sources
Other Literature Sources
Research Materials
