. 2009 Jun 3;96(11):4651-60.
doi: 10.1016/j.bpj.2009.02.058.

Axial tubules of rat ventricular myocytes form multiple junctions with the sarcoplasmic reticulum

Affiliations

Axial tubules of rat ventricular myocytes form multiple junctions with the sarcoplasmic reticulum

Parisa Asghari et al. Biophys J. .

Abstract

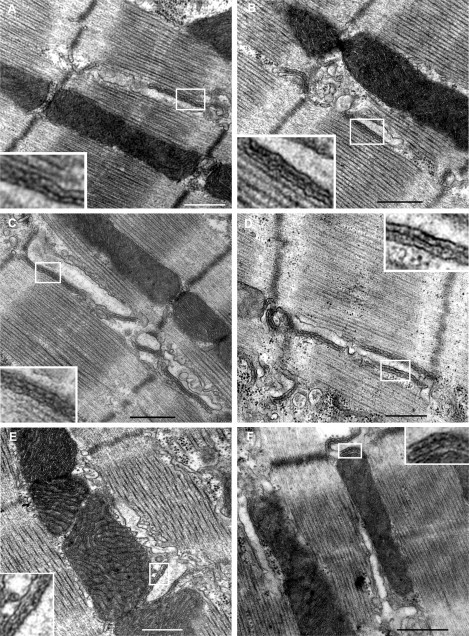
Ryanodine receptors (RyRs) are located primarily on the junctional sarcoplasmic reticulum (SR), adjacent to the transverse tubules and on the cell surface near the Z-lines, but some RyRs are on junctional SR adjacent to axial tubules. Neither the size of the axial junctions nor the numbers of RyRs that they contain have been determined. RyRs may also be located on the corbular SR and on the free or network SR. Because determining and quantifying the distribution of RyRs is critical for both understanding and modeling calcium dynamics, we investigated the distribution of RyRs in healthy adult rat ventricular myocytes, using electron microscopy, electron tomography, and immunofluorescence. We found RyRs in only three regions: in couplons on the surface and on transverse tubules, both of which are near the Z-line, and in junctions on most of the axial tubules--axial junctions. The axial junctions averaged 510 nm in length, but they occasionally spanned an entire sarcomere. Numerical analysis showed that they contain as much as 19% of a cell's RyRs. Tomographic analysis confirmed the axial junction's architecture, which is indistinguishable from junctions on transverse tubules or on the surface, and revealed a complexly structured tubule whose lumen was only 26 nm at its narrowest point. RyRs on axial junctions colocalize with Ca(v)1.2, suggesting that they play a role in excitation-contraction coupling.


Figures

Figure 1
Figure 1
Transmission electron micrographs of junctions in the rat ventricle. (A) A dyad on the T-tubule: ryanodine receptors (single arrow), SR (double arrow), mitochondrion (m), Z-line (z). Scale bar = 100 nm. (B and C) Surface junctions. Insets of the indicated regions are magnified 2.5×: endothelial cell (ec), interstitial space (is). Scale bars = 500 nm.
Figure 2
Figure 2
Longitudinal sections of axial tubules and their junctions. Insets of the indicated regions are magnified 2.5×. (A and B) Axial junctions that are a fraction of a sarcomere long. (C and D) Axial junctions that are a sarcomere in length. (E and F) Axial tubules without junctions. Scale bars = 500 nm.
Figure 3
Figure 3
Frequency histograms. All bins are one twentieth of a sarcomere long. (A) The length of each axial tubule expressed as a fraction of the length of the sarcomere. N = 52. Mean = 0.56, median = 0.44, mode = 0.26, SD = 0.31. (B) The length of each axial junction expressed as a fraction of the length of its axial tubule. N = 40. Mean = 0.66, median = 0.73, mode = 1.00, SD = 0.30. (C) The length of each axial junction expressed as a fraction of the length of the sarcomere. N = 40. Mean = 0.30, median = 0.24, mode = 0.19, SD = 0.18.
Figure 4
Figure 4
Cross sections of axial tubules and their junctions. (A) The axial tubule is nearly encircled by the junction. The inset is a 2.5× magnification of the indicated region; the scale bar is 500 nm. (B) One surface of the axial tubule forms a junction with the adjacent SR (arrow). Scale bar = 100 nm.
Figure 5
Figure 5
Atrial RyRs and Corbular SR. (A) Rat atrium, inset is a 3× magnification of the highlighted surface junction. Scale bar is 500 nm. (B) Rat atrium, inset is a 3× magnification of the highlighted axial junction. Scale bar is 100 nm. (C) Rat atrium. Arrows point to examples of corbular SR. The inset is a 2.5× magnification of the indicated region. (D) Rat ventricle. The sacs of SR are devoid of RyRs. The inset is a 2× magnification of the indicated region. Scale bars are 500 nm.
Figure 6
Figure 6
Tomography of a single longitudinal junction. Scale bar = 100 nm. (A) One plane of the reconstructed tomogram. (B) Tracings of the relevant structures from A: SR (green), individual RyRs (red), CSQ (yellow), transverse and axial tubules (blue). (C) The drawings from each of the planes form the 3D model. (D) The SR and RyRs have been isolated and rotated 70° about the Y-axis.
Figure 7
Figure 7
Tomography of a single longitudinal junction and the transverse tubule to which it is connected. (A and C) Planes 14 and 66 of the tomogram respectively. (B and D) A and C with the tubules numbered and highlighted in blue. Tubules 3, 4, 5, 6, and 7 are transverse tubules; tubules 1and 8 are axial tubules. 3D rendering of the numbered tubules. (E) Orientation is the same as in A–D. Arrow points to connection between tubules 2 and 8. (F) E rotated 180 degrees about the Y-axis. The asterisk marks the connection between tubules 6 and 7. (G) E rotated −90 degrees about the Y-axis, then −45 degrees about the X axis. The asterisk marks the connection between tubules 4, 5, and 7. Tubule 6 is behind tubule 7 and not visible in this orientation.
Figure 8
Figure 8
(A) Rat ventricular myocyte labeled for RyRs (red), Cav1.2 (green). Colocalized voxels are white. (i) A single plane of the data set (278 pixels × 406 pixels × 61 planes), scale bar = 5 μm. (ii) 4× magnification of the indicated transverse tubule. Image dimensions are 45 pixels × 18 pixels × 4 planes. (iii and iv) 10× magnifications of the indicated axial tubules. Image dimensions are 9 pixels × 18 pixels × 3 planes and 9 pixels × 12 pixels × 3 planes, respectively. (B) Comparison of the length of the axial junctions measured by fluorescence microscopy (solid bars; N = 70) and electron microscopy (open bars; N = 40), normalized to the count in the largest bin. For fluorescence microscopy: mean = 0.39, median = 0.32, mode = 1.0, SD = 0.23. (C) The mean colocalization ± SE of RyRs with Cav1.2 (gray bars) and Cav1.2 with RyRs (solid bars). Ten axial tubules and 10 transverse tubules were analyzed from each of seven cells. indicates a significant difference between the indicated groups, p < 0.001.

Similar articles

Cited by

References

    1. Carl S.L., Felix K., Caswell A.H., Brandt N.R., Ball W.J., Jr. Immunolocalization of sarcolemmal dihydropyridine receptor and sarcoplasmic reticular triadin and ryanodine receptor in rabbit ventricle and atrium. J. Cell Biol. 1995;129:672–682. - PMC - PubMed
    1. Franzini-Armstrong C., Protasi F., Ramesh V. Shape, size, and distribution of Ca(2+) release units and couplons in skeletal and cardiac muscles. Biophys. J. 1999;77:1528–1539. - PMC - PubMed
    1. Sun X.H., Protasi F., Takahashi M., Takeshima H., Ferguson D.G. Molecular architecture of membranes involved in excitation-contraction coupling of cardiac muscle. J. Cell Biol. 1995;129:659–671. - PMC - PubMed
    1. Bers D.M. Cardiac excitation-contraction coupling. Nature. 2002;415:198–205. - PubMed
    1. Jorgensen A.O., Broderick R., Somlyo A.P., Somlyo A.V. Two structurally distinct calcium storage sites in rat cardiac sarcoplasmic reticulum: an electron microprobe analysis study. Circ. Res. 1988;63:1060–1069. - PubMed

Publication types

MeSH terms

Substances