. 2009 Aug;37(14):e96.
doi: 10.1093/nar/gkp448. Epub 2009 May 31.

Gene silencing in the marine diatom Phaeodactylum tricornutum

Affiliations

Gene silencing in the marine diatom Phaeodactylum tricornutum

Valentina De Riso et al. Nucleic Acids Res. 2009 Aug.

Abstract

Diatoms are a major but poorly understood phytoplankton group. The recent completion of two whole genome sequences has revealed that they contain unique combinations of genes, likely recruited during their history as secondary endosymbionts, as well as by horizontal gene transfer from bacteria. A major limitation for the study of diatom biology and gene function is the lack of tools to generate targeted gene knockout or knockdown mutants. In this work, we have assessed the possibility of triggering gene silencing in Phaeodactylum tricornutum using constructs containing either anti-sense or inverted repeat sequences of selected target genes. We report the successful silencing of a GUS reporter gene expressed in transgenic lines, as well as the knockdown of endogenous phytochrome (DPH1) and cryptochrome (CPF1) genes. To highlight the utility of the approach we also report the first phenotypic characterization of a diatom mutant (cpf1). Our data open the way for reverse genetics in diatoms and represent a major advance for understanding their biology and ecology. Initial molecular analyses reveal that targeted downregulation likely occurs through transcriptional and post-transcriptional gene silencing mechanisms. Interestingly, molecular players involved in RNA silencing in other eukaryotes are only poorly conserved in diatoms.


Figures

Figure 1.
Figure 1.
(A) Wild-type (left) and transgenic P. tricornutum cells (right) expressing the GUS gene, grown on agar plates and stained for GUS activity. Groups of cells are shown in blow up. GUS activity in the Pt/GUS strain used for the silencing analysis is indicated. (B) Schematic maps of the anti-sense and the inverted repeat constructs. Anti-sense constructs: GUS fragments of 240 or 390 bp cloned between the stop codon of the selectable Sh ble gene and the diatom FcpA terminator region. Inverted-repeat constructs: the GUS fragments were cloned in sense and anti-sense orientation. The region of self-complementarity is shown in blue, whereas the non-complementary region (corresponding to the spacer) is indicated by the diagonal lines. H4p (Histone 4 promoter), FcpBp (Fucoxanthin Chlorophyll a/c-binding Protein B promoter).
Figure 2.
Figure 2.
Molecular analysis of silenced clones. (A) PCR analysis of the full length GUS gene in the untransformed wild-type strain (wt), in the transgenic GUS expressing cells (Pt/GUS), and in selected silenced clones. M, 1 Kb DNA size marker. (B) GUS activity of the clones shown in (A). Values are normalized to the mean GUS activity of the Pt/GUS strains (100% activity). Pt/GUS data are the mean of 10 independent sub-clones from the GUS parental transgenic strain. (C) Relative GUS mRNA levels analysed by qRT-PCR in the same strains, and normalized with respect to the expression of an internal standard RPS gene.
Figure 3.
Figure 3.
De novo cytosine methylation in silenced clones. Methylation analysis performed on the Pt/GUS expressing cells, and on selected silenced clones. (A) PCR amplifications performed on genomic DNA digested with McrBC, in the presence (+) and absence (–) of GTP, using primer sets specific for the GUS transgene and its regulatory regions. PCR analysis shows the amplification of the FcpBp region (PCR1), amplification of the first (PCR2) and second (PCR3) half of the GUS gene, the terminator region (PCR4), and amplification of the CPF1 gene used as control. Arrows indicate the bands corresponding to the expected amplification products. M, 1-kb DNA size marker. Schematic representation of the genomic region used for the analysis and the region targeted for silencing is indicated above. (B) Schematic representation of the methylation profile obtained by bisulfite sequencing of the fir-1 clone. Vertical bars show the distribution of mC in the sense and anti-sense strands. The targeted region is indicated.
Figure 4.
Figure 4.
Silencing of endogenous DPH1 and CPF1. (A and B) Schematic representation of the fir-Dph1 and hir- and fir-CPF1 constructs used for transformation. (C and D) Schematic representation of DPH1 and CPF1 targeted regions. (E and F) Analysis of Dph1 and CPF1 protein levels by immunoblot in independent silenced lines (clones dph1-1 to dph1-3, and clones cpf1-1 to cpf1-3). Dph1 and CPF1 protein levels were quantified using a serial dilution of proteins from wild-type cells as standard. The same membranes were incubated with D2, and histone H3 antibodies as loading control, respectively. (G and H) DPH1 and CPF1 mRNA levels in the silenced clones quantified by qRT-PCR. Normalization was done relative to RPS mRNA.
Figure 5.
Figure 5.
Effect of CPF1 downregulation on UV damage response and light-induced gene expression. (A) cpf1-1 growth defect after UV-C irradiation. Dilution series of wild-type and cpf1-1 cells were grown for 1 week after exposure to UV light at 100 J/m2. (B) Analysis of FCP a/c and GLNAII mRNA levels in 60-h dark-adapted cultures and then exposed for 5 min to 3.3 µmol m–2 s–1 of blue light. Relative transcript levels were determined by qRT-PCR using RPS as a reference gene. Values were normalized to gene expression levels in the dark.
Figure 6.
Figure 6.
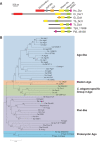
Possible candidates for diatom Dicer-like and AGO-like RNAi components. (A) Schematic representation of domains found in various Dicer (Dcr) and Dicer-like (Dcl) proteins. Domain abbreviations: DEXDc/HELIc, DEAD-like helicase domain/helicase C-terminal domain; DUF283, DUF283 domain; PAZ, PAZ domain; RNAseIII (a-b), ribonuclease III domains a and b and dsRBD, double-stranded RNA-binding domain. Species abbreviations: Cr, Chlamydomonas reinhardtii; Gi, Giardia intestinalis; Hs, Homo sapiens; Pt, Phaeodactylum tricornutum; Tb, Trypanosoma brucei; Tp, Thalassiosira pseudonana; Tt, Tetrahymena thermophila. (B) Phylogenetic analysis of the diatom Argonaute-like proteins. Phylogenetic tree constructed using the MEGA 4.0 platform with the Neighbor-Joining method from a MUSCLE alignment of the PAZ and AGO domains from Ago-like, Piwi-like, Caenorhabditis elegans-specific group 3 Argonautes, prokaryotic Argonautes, and the putative diatom Ago-Piwi-like proteins identified in this work. The alignment was manually refined to remove gaps and erroneous positions. Numbers indicate interior branch bootstrap values as percentage, based on 1000 pseudoreplicates (only values >60% are shown). Species abbreviations and accession numbers of proteins used to draw the tree: Aa, Aquifex aeolicus (AA Ago gi126031218); Af, Archaeoglobus fulgidus (Af Ago gi60593831); An, Aspergillus nidulans (AN1519, EAA63775); At, Arabidopsis thaliana (At Ago1 AAC18440, At Ago4 NP565633, At Ago5 NP850110, At Ago7 ZIP NP177103, At Ago10 CAA11429); Ce, C. elegans (CeC04F12.1 gi17505468, Ce ZK757.3 gi17557077, Ce R04A9.2 gi17569229, Ce PRG1 gi3875393, Ce T23D8.7 gi3880077, Ce RDE1 gi6272678, Ce Alg1 gi25148113, Ce csr1 gi115532838, Ce ergo1 gi25148583, Ce ppw1 NP740835, Ce ppw2 AAF60414); Dd, Dictyostelium discoideum (Dd AgnA EAL69296, Dd AgnC EAL71514); Dm, Drosophila melanogaster (Dm Ago1 BAA88078, Dm Ago2 Q9VUQ5, Dm Aub CAA64320, Dm Piwi Q9VKM1); Eh, Entamoeba histolytica (Eh EAL51127); Gi, G. intestinalis (Gi GLP XP779885); Hs, H. sapiens (Hs Ago1 AAH63275, Hs Hiwi AAC97371); Nc, Neurospora crassa (Nc Qde2 AAF43641, Nc Sms2 AAN32951); Pf, Pyrococcus furiosus (Pf Ago gi62738878); Pte, Paramecium tetraurelia (Pte Ptiwi05 CAI44468, Pte Ptiwi10 CAI39070, Pte Ptiwi13 CAI39067, Pte Ptiwi15 CAI39065); Sp, Strongylocentrotus purpuratus (Sp Ago1 XP782278, Sp Seawi AAG42533); Spo, Saccharomyces pombe (Ago1 O74957); Tb, T. brucei (Ago1 O74957); Tt, T. thermophila (Tt Twi1p AAM77972, Tt Twi2p AAQ74967); Ps, Phytophtora sojae (1109613, 1157728); Pt, P. tricornutum (FJ750269); Tp, T. pseudonana (FJ750270).

References

    1. Falkowski PG, Barber RT, Smetacek VV. Biogeochemical controls and feedbacks on ocean primary production. Science. 1998;281:200–207. - PubMed
    1. Smetacek V. Diatoms and the ocean carbon cycle. Protist. 1999;150:25–32. - PubMed
    1. Armbrust EV, Berges JA, Bowler C, Green BR, Martinez D, Putnam NH, Zhou S, Allen AE, Apt KE, Bechner M, et al. The genome of the diatom Thalassiosira pseudonana: ecology, evolution, and metabolism. Science. 2004;306:79–86. - PubMed
    1. Montsant A, Andrew EA, Coesel S, De Martino A, Falciatore A, Heijde M, Jabbari K, Maheswari U, Mangogna M, Rayko E, et al. Identification and comparative genomic analysis of signaling and regulatory mechanisms in the diatom Thalassiosira pseudonana. J. Phycol. 2007;43:585–604.
    1. Bowler C, Allen AE, Badger JH, Grimwood J, Jabbari K, Kuo A, Maheswari U, Martens C, Maumus F, Otillar RP, et al. The Phaeodactylum genome reveals the evolutionary history of diatom genomes. Nature. 2008;456:239–244. - PubMed

Publication types