. 2009 Jun 8;206(6):1423-34.
doi: 10.1084/jem.20081720. Epub 2009 Jun 1.

Priming of protective T cell responses against virus-induced tumors in mice with human immune system components

Affiliations

Priming of protective T cell responses against virus-induced tumors in mice with human immune system components

Till Strowig et al. J Exp Med. .

Abstract

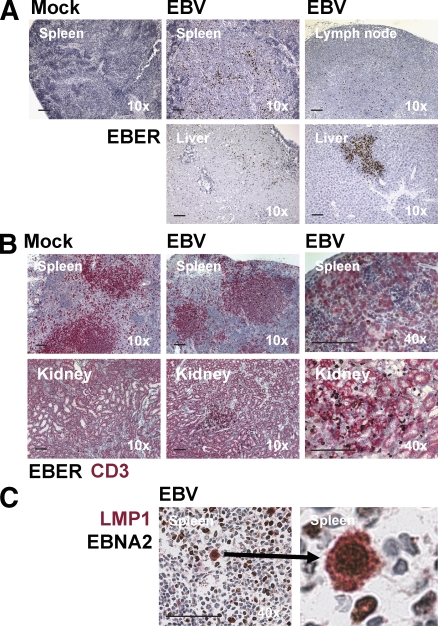
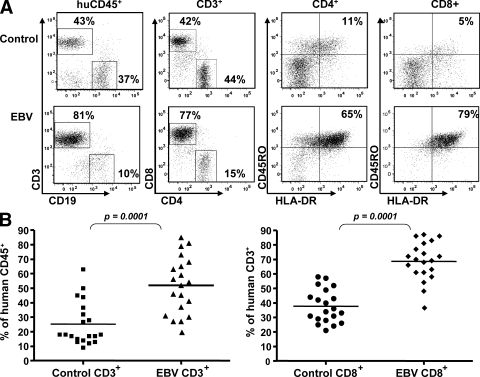
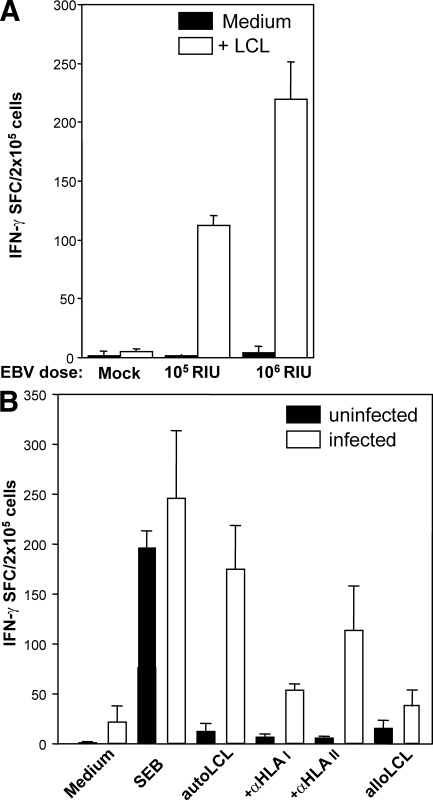
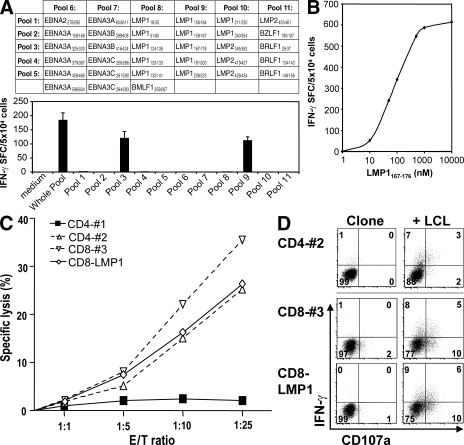
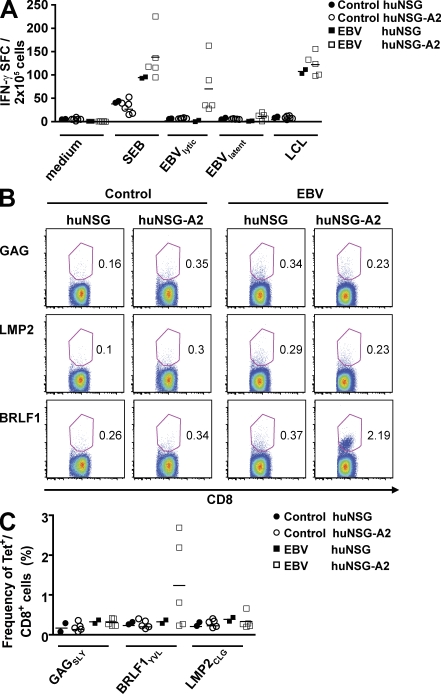
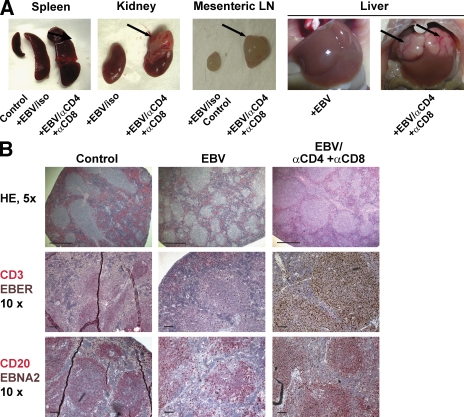
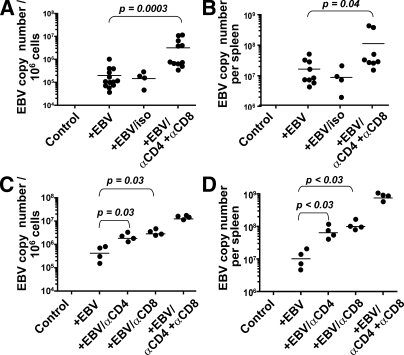
Many pathogens that cause human disease infect only humans. To identify the mechanisms of immune protection against these pathogens and also to evaluate promising vaccine candidates, a small animal model would be desirable. We demonstrate that primary T cell responses in mice with reconstituted human immune system components control infection with the oncogenic and persistent Epstein-Barr virus (EBV). These cytotoxic and interferon-gamma-producing T cell responses were human leukocyte antigen (HLA) restricted and specific for EBV-derived peptides. In HLA-A2 transgenic animals and similar to human EBV carriers, T cell responses against lytic EBV antigens dominated over recognition of latent EBV antigens. T cell depletion resulted in elevated viral loads and emergence of EBV-associated lymphoproliferative disease. Both loss of CD4(+) and CD8(+) T cells abolished immune control. Therefore, this mouse model recapitulates features of symptomatic primary EBV infection and generates T cell-mediated immune control that resists oncogenic transformation.


Figures

Figure 1.
Figure 1.
EBV-infected cells are detected in hu-NSG mice in multiple organs and express EBNA2 and LMP1. (A) EBV-infected cells could be detected in the indicated organs by EBER hybridization. (B) EBER+ cells were surrounded by T cells (CD3+) both in the spleen and after migration to the kidney. (C) EBNA2+ cells coexpressed LMP1 in the spleen (the right panel is a magnification of the left panel). These analyses were performed 4–6 wk after EBV infection. Data are representative of three independent experiments. Bars, 100 µm.
Figure 2.
Figure 2.
Expansion of human CD3+ T cells after EBV infection. (A) Splenocytes from control or EBV-infected animals were harvested 6 wk after infection. Frequencies of lymphocyte subsets were determined by flow cytometry. Activation and memory phenotypes of both the CD4+ and CD8+ T cells were monitored by measuring the up-regulation of the HLA-DR and CD45RO surface markers, respectively. Representative data from 10 experiments are shown. (B) Summary of CD3+CD8+ T cell expansion for 40 mice in 10 different experiments. Horizontal bars represent means.
Figure 3.
Figure 3.
Dose-dependent induction of HLA-restricted T cell responses against autologous EBV-transformed B cells in infected hu-NSG mice. (A) Reconstituted NSG mice were infected with 105 or 106 RIU EBV. 6 wk after infection, human B cell–depleted splenocytes were incubated with autologous EBV-transformed B cells (LCLs) to measure EBV-specific IFN-γ secretion using ELISPOT assays. IFN-γ–specific spots per 105 cells are shown for a representative experiment with three mice in each group. One representative out of six experiments is shown. (B) Humanized NSG mice were infected with 106 RIU EBV. 6 wk after infection, splenocytes were harvested from control and infected animals, and T cell reactivity was evaluated by IFN-γ ELISPOT assays under similar conditions as described in A. Staphylococcal enterotoxin B (SEB) superantigen and allogenic LCLs were used as positive and negative controls, respectively. Human HLA restriction was determined using inhibitory antibodies against HLA I and II as indicated. One representative out of two experiments is shown. Data represent means + SD. SFC, spot-forming cells.
Figure 4.
Figure 4.
Isolation of EBV-specific T cell clones from infected hu-NSG mice. (A) T cell clones were established by limiting dilution cloning from sorted CFSElow T cells of spleens from animals 6 wk after EBV infection. These T cells had proliferated in response to EBV-transformed B cells (LCLs) or EBV-derived peptides. The library of 33 EBV peptides that was used for the initial T cell proliferation was divided into the indicated matrix of peptide pools and used to assess the fine specificity of obtained T cell clones. Reactivity of one out of three CD8+ T cell clones specific for the HLA-A2–restricted peptide LMP1167-176 in IFN-γ ELISPOT is shown. (B) Epitope affinity was determined by cognate peptide titration on LMP1167-176–specific CD8+ T cells in IFN-γ ELISPOT assays. One representative out of two experiments is shown. (C) The cytotoxicity of LMP1167-176–specific (CD8-LMP1) and LCL-specific (#1–3) CD4+ and CD8+ T cell clones against autologous EBV-transformed B cells (LCLs) was assessed by flow cytometric TO-PRO-3-iodide exclusion assays at the indicated effector/target ratios (E/T). One representative out of three experiments is shown. (D) Degranulation and IFN-γ production were evaluated after co-culture with autologous LCLs by flow cytometric surface staining for CD107a and intracellular IFN-γ staining (percentages are shown). One representative out of three experiments is shown.
Figure 5.
Figure 5.
Enhanced priming of CD8+ T cell responses against dominant EBV peptides in HLA-A2 transgenic hu-NSG mice. (A) HLA-A2 transgenic and nontransgenic NSG mice were reconstituted with HLA-A2+ CD34+ HPCs from the same donor. 4 wk after EBV infection or mock treatment, splenocytes were restimulated for IFN-γ ELISPOT assays with medium alone, staphylococcal enterotoxin B (SEB) as a positive control, the autologous EBV-transformed B cell line (LCLs), 8 lytic EBV antigen–derived dominant CD8+ T cell epitopes, and 12 latent EBV antigen–derived CD8+ T cell epitopes, which had been defined as dominant CD8+ T cell epitopes in human EBV carriers. The data summarize two independent experiments. (B and C) In parallel, tetramer staining on splenocytes of EBV-infected or control mice was performed ex vivo. Tetramers of HLA-A*0201 with the HIV gag aa 77–85 (GAGSLY), EBV LMP2 aa 426–434 (LMP2CLG), or EBV BRLF1 aa 109–117 (BRLF1YVL) peptides were used in costaining with anti-CD8 and analyzed by flow cytometry (percentages are shown). B shows a representative experiment and C shows the summary of two independent experiments. Horizontal bars represent means.
Figure 6.
Figure 6.
Development of EBV-associated tumors in EBV-infected hu-NSG mice after T cell depletion. (A) Disseminated tumors in EBV-infected animals after T cell depletion. T cell depletion in hu-NSG mice, which had been infected with EBV for 4–5 wk, resulted in splenomegaly and EBV-positive tumors either in the kidney, mesenteric lymph node, or liver (arrows). T cell–depleted and EBV-infected hu-NSG mice (EBV/αCD4+αCD8; n = 11) were compared with EBV-infected hu-NSG mice (EBV; n = 13), EBV-infected hu-NSG mice treated with isotype control antibodies (EBV/iso; n = 4), and uninfected hu-NSG mice (control; n = 11). Representative images are shown. Data summarize three independent experiments. (B) Immunohistological characterization of representative spleen sections of T cell–depleted and EBV-infected, EBV-infected and mock-treated, or uninfected hu-NSG mice. Splenic architecture was assessed by hematoxylin and eosin staining (HE), EBV-infected cells were identified by either EBER in situ hybridization (EBER) or staining with EBNA2-specific antibodies (EBNA2), and T and B cell content was characterized by CD3- and CD20-specific antibody staining, respectively. Bars: (HE) 500 µm; (CD3/EBER and CD20/EBNA2) 100 µm.
Figure 7.
Figure 7.
Elevated viral loads in T cell–depleted and EBV-infected hu-NSG mice. (A) Splenic EBV loads were determined by quantitative real-time PCR 4 wk after EBV infection. Viral titers were calculated from three independent experiments with a total of 39 animals. No EBV titers were detected in uninfected hu-NSG mice (control). Samples were analyzed at least in duplicates, and statistical significance was calculated using the Mann-Whitney U test. (B) Total splenic EBV loads were determined by multiplying splenic viral loads determined as in A with total splenocyte numbers determined by counting. Results are shown for seven control mice, nine EBV-infected mice, four EBV-infected and isotype control antibody–treated mice, and eight T cell–depleted and EBV-infected mice. Statistical significance was calculated using the Mann-Whitney U test. (C) EBV episome copy numbers in 106 splenocytes were determined in EBV-infected hu-NSG mice after CD4+ (αCD4) and CD8+ (αCD8) T cell single depletions, as well as double depletion (αCD4+αCD8). Composite data of two independent experiments are shown and were statistically analyzed using the Mann-Whitney U test. (D) Total viral loads per spleen were calculated from the viral copy numbers per 106 cells multiplied by the total counted splenocyte numbers. Statistical significance was assessed with the Mann-Whitney U test. Horizontal bars represent means.

References

    1. Mestas J., Hughes C.C. 2004. Of mice and not men: differences between mouse and human immunology.J. Immunol. 172:2731–2738 - PubMed
    1. Waterston R.H., Lindblad-Toh K., Birney E., Rogers J., Abril J.F., Agarwal P., Agarwala R., Ainscough R., Alexandersson M., An P., et al. 2002. Initial sequencing and comparative analysis of the mouse genome.Nature. 420:520–562 - PubMed
    1. Young L.S., Rickinson A.B. 2004. Epstein-Barr virus: 40 years on.Nat. Rev. Cancer. 4:757–768 - PubMed
    1. Cohen J.I. 2000. Epstein-Barr virus infection.N. Engl. J. Med. 343:481–492 - PubMed
    1. Kelly G.L., Milner A.E., Baldwin G.S., Bell A.I., Rickinson A.B. 2006. Three restricted forms of Epstein-Barr virus latency counteracting apoptosis in c-myc-expressing Burkitt lymphoma cells.Proc. Natl. Acad. Sci. USA. 103:14935–14940 - PMC - PubMed

Publication types

MeSH terms