. 2009 Jun 8;206(6):1253-72.
doi: 10.1084/jem.20090365. Epub 2009 Jun 1.

The first T cell response to transmitted/founder virus contributes to the control of acute viremia in HIV-1 infection

Affiliations

The first T cell response to transmitted/founder virus contributes to the control of acute viremia in HIV-1 infection

Nilu Goonetilleke et al. J Exp Med. .

Abstract

Identification of the transmitted/founder virus makes possible, for the first time, a genome-wide analysis of host immune responses against the infecting HIV-1 proteome. A complete dissection was made of the primary HIV-1-specific T cell response induced in three acutely infected patients. Cellular assays, together with new algorithms which identify sites of positive selection in the virus genome, showed that primary HIV-1-specific T cells rapidly select escape mutations concurrent with falling virus load in acute infection. Kinetic analysis and mathematical modeling of virus immune escape showed that the contribution of CD8 T cell-mediated killing of productively infected cells was earlier and much greater than previously recognized and that it contributed to the initial decline of plasma virus in acute infection. After virus escape, these first T cell responses often rapidly waned, leaving or being succeeded by T cell responses to epitopes which escaped more slowly or were invariant. These latter responses are likely to be important in maintaining the already established virus set point. In addition to mutations selected by T cells, there were other selected regions that accrued mutations more gradually but were not associated with a T cell response. These included clusters of mutations in envelope that were targeted by NAbs, a few isolated sites that reverted to the consensus sequence, and bystander mutations in linkage with T cell-driven escape.


Figures
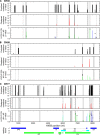
Figure 1.
Figure 1.
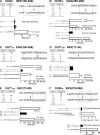
Identification of putative sites of positive selection using three independent tests. Subjects shown are CH40 (A), CH58 (B), and CH77 (C). The horizontal axis indicates nucleotide positions aligned to HXB2 (nt 750–9750), and the vertical axis indicates significance from each of three tests. Tests for enriched mutations and clustered mutations (black and red bars, respectively) used sliding windows of 45 and 27 nt, respectively. Fixed-effects likelihood (FEL) test results from HYPHY are color coded to reflect the reading frame of the codon (+1, blue; +2, cyan; +3, green). Because overlapping reading frames or recombination might influence FEL results, the FEL test was repeated for aligned fragments without regions where reading frames overlap and partitioned at potential recombination breakpoints (black x). Epitope locations for CTL (gray stripes) and NAb (black stripes) epitopes are juxtaposed. For reference, a map of the HXB2 genome appears below. Methods are detailed in the text. Not shown are 10 (4 in CH40, 4 in CH58, 2 in CH77) regions that were identified as under selection by the first test but were predominantly the consequence of clusters of silent mutations, at least in the standard reading frames for HIV proteins. Some might represent cryptic epitopes, T cell response encoded in unconventional reading frames (63).
Figure 2.
Figure 2.
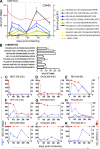
Virus sequence changes emerge both early and rapidly at multiple sites across the HIV-1 proteome over the 12 mo after infection. Full-length SGA sequencing was performed at screening (0 d) for CH40, CH77, and CH58. Sequencing at multiple time points (indicated to the left of each block as days) subsequent to screening used SGA techniques but was derived from separate sequencing of the 5′ (Gag and Pol) and 3′ (Vif, Vpr, Tat, Rev, Vpu, Env, and Nef) regions of the virus genome. The sites in which significant variation was detected by 6 mo after infection are identified in columns including the percentage of SGA sequences that contained nonsynonymous (n.s.) changes at each time point. Some percentages are reported in either red or blue text. Red text indicates early and rapid escapes where n.s. changes occurred in at least 50% of SGA sequences by ∼50 d after screening. Blue text identifies those sites that were experimentally confirmed as containing Nab epitopes. Boxed columns identify T cell epitopes, with dotted boxes (red or black) indicating known or putative CTL motifs according to each patient's HLA type (four digits), whereas solid boxes (red or black) identify those sites found in reactive peptides confirmed in T cell assays. Above solidly boxed columns, the reactive 18-mer peptide, relative to HXB2 standards, is shown and, if confirmed, the optimal CTL peptide. Below each column, n.s. substitutions are shown in parentheses; orange text indicates reversions to consensus clade B. * identifies those n.s. substitutions that were present in >50% of SGA sequences at the final visit. # denotes an insertion. The lower case letter preceding the protein (e.g., a. Gag) is a reference used throughout the paper and supplements to denote regions of positive selection. CH77.l and CH58.f identify regions of change in overlapping reading frames.
Figure 3.
Figure 3.
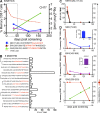
Examples of different patterns of escape. The alignment shows the transmitted form of the peptide that was susceptible to T cells with the variants that were observed over the course of the study underneath. Dashes indicate aa that are identical to the transmitted form and letters indicate aa substitutions. The days from screening (left), the sequence (center), and occurrence of each variant and frequency (right) are shown. A plot of the frequencies of each form over time is shown above the alignment; the colors of the sequences correspond to those of the lines. The transmitted form is shown in black, the most common form at the last time point in red. The pattern shown in A, where a single variant completely replaced the transmitted form, was rare. The pattern in B was typical of rapid escape; the transmitted form was lost very quickly, but many mutated forms were rapidly explored by the virus, and the dominant form at the last time point was not among the earliest escape mutations. The pattern in C was typical of more gradual escape with continuing evolution, but this is a Gag epitope, where escape patterns tended to be of reduced complexity overall. Kinetic patterns of variation for all 19 peptides that stimulated T cell responses are shown in Fig. S2. All alignments and frequencies for all regions of interest are in the supplemental text.
Figure 4.
Figure 4.
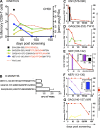
Early and rapid loss of the transmitted form and acquisition of ns mutations within the first weeks of HIV-1 infection result from T cell selection pressure. Within each panel, the HXB2 position sequence of both the wild-type and mutated peptides are given. The percentage of founder virus, which is the proportion of SGA sequences produced which contain founder sequence spanning that relevant 18-mer peptide, is also given. The wild-type and mutated peptides, as well as HLA-matched known or predicted optimal epitopes, were tested in ex vivo IFN-γ ELISpot or ICS. CH40, A and B; CH77, C–E; CH58, F. ELISpot data are expressed as the mean spot forming units (SFU) per million PBMC (SFU/106) ± SEM and ICS data as percentage of CD8 memory T cells secreting IFN-γ, IL-2, MIP-1β, TNF-α, and/or CD107a.
Figure 5.
Figure 5.
T cell responses induced in acute HIV-1 infection in CH40. Ex vivo IFN-γ ELISpots were performed in CH40 over the first 12 mo of infection. (A) T cell responses that were both >50 SFU/106 and 4× background at one or more time points are shown. Data are expressed as the mean SFU/106 PBMC ± SEM. Line color is used to group T cell responses that peaked at different times during the first year of HIV-1 infection. (B) Mapped T cell responses against the transmitted HIV-1 virus 181 d after screening for CH40. Each panel shows the T cell response to the 18-mer peptide (position relative to HXB2 standards) described in the title. (C–K) Ex vivo IFN-γ ELISpots were performed on PBMC at the days indicated using peptides matching the transmitted virus. Data are graphed against percentage of transmitted virus, which reflects the proportion of SGA sequences produced at each time point that contain the transmitted virus sequence spanning that 18-mer peptide. The purple dotted line in H shows the percentage of transmitted virus in the proximal site CH40.d that may have had an impact on the processing of the Pol 80–97 epitope.
Figure 6.
Figure 6.
T cell responses induced in acute HIV-1 infection in CH77. (A) The kinetics of the T cell cytokine response to the three epitopes that underwent early rapid escape and the B*5701 TW10 response that became immunodominant at 6 mo were described using ICS measuring total cytokine production in memory CD8 T cells. The dotted gray box highlights the first 50 d after screening when the virus load is declining to set point. Virus escapes that occurred in this period are denoted as both early and rapid. (B) Mapped T cell responses against the transmitted HIV-1 virus 159 d after screening for CH77 with overlapping peptides group with brackets with B*5701 epitopes highlighted in red. (C–F) Ex vivo IFN-γ ELISpots (C) or ICS (D–F) were performed on PBMC from patient CH77 at the days indicated using peptides matching the transmitted virus. Data from both patients are graphed against the percentage of wild-type virus, which reflects the proportion of SGA sequences produced at each time point that contain the transmitted virus sequence spanning that 18-mer peptide. Data are expressed as the mean SFU/106 PBMC. Error bars in C show SEM. ICS data represent the percentage of the background-subtracted IFN-γ, TNF-α, MIP-1β, IL-2, and CD107α production in memory CD8 T cells. Additional ELISpot data are shown as insets in D and E.
Figure 7.
Figure 7.
T cell responses induced in acute HIV-1 infection in CH58. (A) The kinetics of the T cell cytokine response using ICS measuring the total IFN-γ, TNF-α, MIP-1β, IL-2, and CD107α T cell response in memory CD8 T cells. (B) Mapped T cell responses against the transmitted HIV-1 virus 145 d after screening for CH58. In C–G, each panel shows the T cell response, either by ICS or IFN-γ ELISpot, to the 18-mer peptide (position relative to HXB2 standards) described in the title and is graphed against the percentage of wild-type virus, which reflects the proportion of SGA sequences produced at each time point that contain the transmitted virus sequence spanning that 18-mer peptide. The inset in E shows that the T cell response, as measured by ELISpot to a pool of mutant peptides (M), RRQDILDLWVYHTQGYFP, KRQEILDLWVYHTQGYFP, was half that of the response to the transmitted sequence peptide KRQDILDLWYHTQGYFP (T). The purple dotted line in F shows the percentage of transmitted virus in the proximal site CH58.h that may have impacted on processing of the Nef 113–130 epitope. The inset in F shows the ELISpot response at day 70 to the optimal B*5701-restricted epitope HW10. In G, only three SGA sequences were produced at the indicated timepoint (+), so although some variation from the transmitted virus was detected, the changes were not significant in any of the three tests used (i.e., not listed in Fig. 2). Error bars in B, E, and F indicate SEM.
Figure 8.
Figure 8.
Mathematical modeling fitted to the he measured changes in the frequency of T cell escape mutations suggests that the first T cells induced by HIV-1 infection contribute to the control of acute viremia. Data shown is from patients CH40 (A), CH77 (B), CH58 (C), and SUMA0874 (D). CH77.b and CH58.b mutations occurred within the IW9 Gag epitope. CH77.c and CH58.c mutations occurred within the Gag TW10 epitope.

References

    1. Gasper-Smith N., Crossman D.M., Whitesides J.F., Mensali N., Ottinger J.S., Plonk S.G., Moody M.A., Ferrari G., Weinhold K.J., Miller S.E., et al. 2008. Induction of plasma (TRAIL), TNFR-2, Fas ligand, and plasma microparticles after human immunodeficiency virus type 1 (HIV-1) transmission: implications for HIV-1 vaccine design.J. Virol. 82:7700–7710 - PMC - PubMed
    1. Brenchley J.M., Schacker T.W., Ruff L.E., Price D.A., Taylor J.H., Beilman G.J., Nguyen P.L., Khoruts A., Larson M., Haase A.T., Douek D.C. 2004. CD4+ T cell depletion during all stages of HIV disease occurs predominantly in the gastrointestinal tract.J. Exp. Med. 200:749–759 - PMC - PubMed
    1. Fiebig E.W., Wright D.J., Rawal B.D., Garrett P.E., Schumacher R.T., Peddada L., Heldebrant C., Smith R., Conrad A., Kleinman S.H., Busch M.P. 2003. Dynamics of HIV viremia and antibody seroconversion in plasma donors: implications for diagnosis and staging of primary HIV infection.AIDS. 17:1871–1879 - PubMed
    1. Fellay J., Shianna K.V., Ge D., Colombo S., Ledergerber B., Weale M., Zhang K., Gumbs C., Castagna A., Cossarizza A., et al. 2007. A whole-genome association study of major determinants for host control of HIV-1.Science. 317:944–947 - PMC - PubMed
    1. Ho D.D. 1996. Viral counts count in HIV infection.Science. 272:1124–1125 - PubMed

Publication types

MeSH terms