. 2009 Jun 1;23(11):1313-26.
doi: 10.1101/gad.1781009.

Integration of microRNA miR-122 in hepatic circadian gene expression

Affiliations

Integration of microRNA miR-122 in hepatic circadian gene expression

David Gatfield et al. Genes Dev. .

Abstract

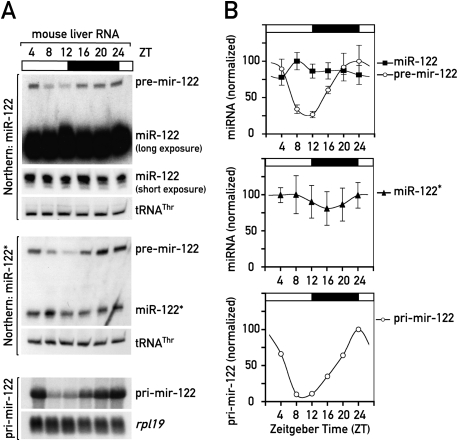
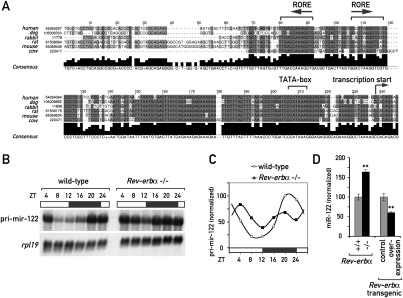
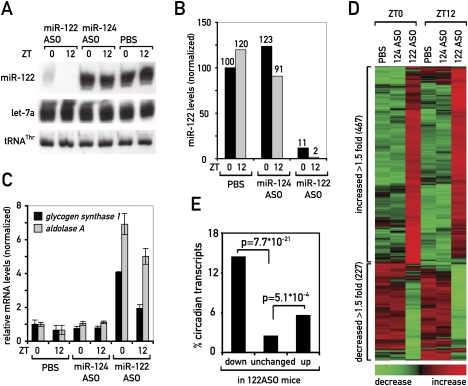
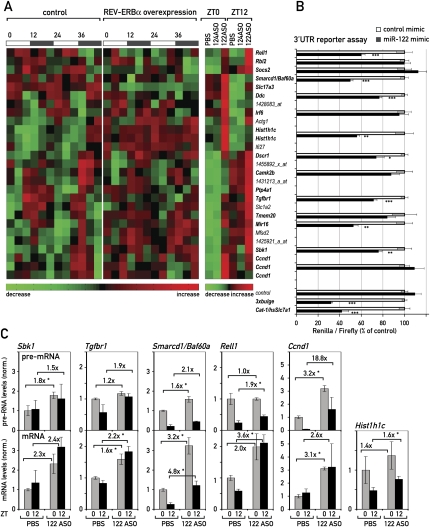
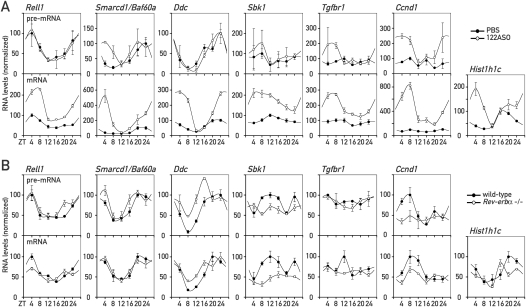
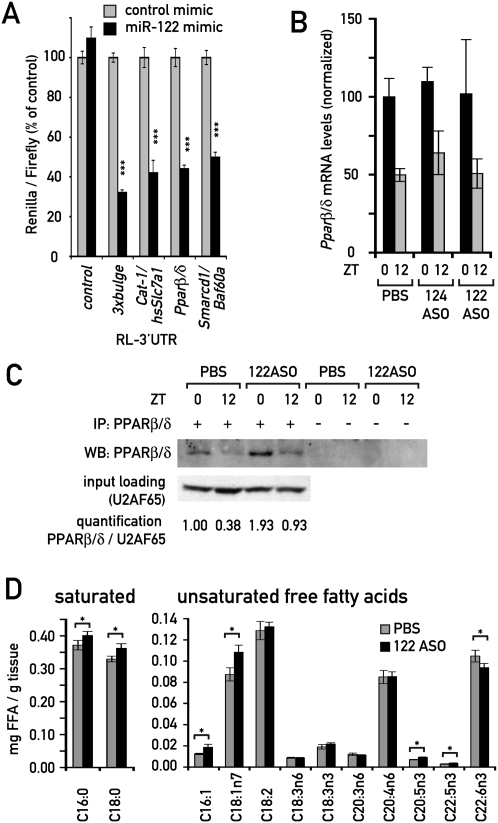
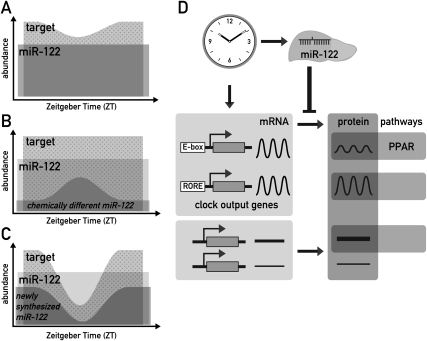
In liver, most metabolic pathways are under circadian control, and hundreds of protein-encoding genes are thus transcribed in a cyclic fashion. Here we show that rhythmic transcription extends to the locus specifying miR-122, a highly abundant, hepatocyte-specific microRNA. Genetic loss-of-function and gain-of-function experiments have identified the orphan nuclear receptor REV-ERBalpha as the major circadian regulator of mir-122 transcription. Although due to its long half-life mature miR-122 accumulates at nearly constant rates throughout the day, this miRNA is tightly associated with control mechanisms governing circadian gene expression. Thus, the knockdown of miR-122 expression via an antisense oligonucleotide (ASO) strategy resulted in the up- and down-regulation of hundreds of mRNAs, of which a disproportionately high fraction accumulates in a circadian fashion. miR-122 has previously been linked to the regulation of cholesterol and lipid metabolism. The transcripts associated with these pathways indeed show the strongest time point-specific changes upon miR-122 depletion. The identification of Pparbeta/delta and the peroxisome proliferator-activated receptor alpha (PPARalpha) coactivator Smarcd1/Baf60a as novel miR-122 targets suggests an involvement of the circadian metabolic regulators of the PPAR family in miR-122-mediated metabolic control.


Figures

Figure 1.
Figure 1.
miR-122 precursors are circadian in mouse liver. (A) Northern blot analysis of miR-122 and its precursor RNAs using whole-cell RNA from male C57BL/6 mice sacrificed at the indicated ZT values around the clock. An RNA pool from three mice was used per time point, tRNAThr and rpl19 mRNA served as loading controls in denaturing polyacrylamide (top and middle panels) and agarose gel electrophoresis (bottom panels), respectively. (Top panels) miR-122 and pre-mir-122. (Middle panels) pre-mir-122 and miR-122*. miR-122* is the antisense “passenger strand” that is incorporated into RISC at low levels. (Bottom panels) pri-mir-122. (B, top and middle panels) miR-122, miR-122* and pre-mir-122 levels, normalized to tRNAThr, from Northern blots in which single animals were analyzed (data not shown). Mean values ± SEM. (Bottom panel) Quantification of pri-mir-122 levels, normalized to the circadianly invariant rpl19, from the Northern blot shown in A.
Figure 2.
Figure 2.
REV-ERBα is involved in circadian control of the miR-122 locus. (A) Alignment of the genomic sequence upstream of the predicted transcriptional start site of pri-mir-122 in six mammalian species (extracted from the University of California at Santa Cruz alignment; see Supplemental Fig. 3). The predicted ROREs, TATA-box, and transcriptional start site are indicated. (B) Northern blot analysis of pri-mir-122 in total RNA samples from Rev-erbα knockout and littermate control mice sacrificed at the indicated ZT values around the clock. For each time point, an RNA pool of three female mice was used. (C) Quantification of the Northern blot shown in B; values are pri-mir-122 normalized to rpl19. (D) miR-122 levels in total liver RNA from individual animals (mixed ZTs) of the indicated genotypes were quantified by Northern blot (data not shown). Control animals were set to 100%. Data are mean ± SEM (n = 36 for Rev-erbα−/− vs. Rev-erbα+/+ and n = 18 for REV-ERBα overexpression vs. control); (**) P < 5*10−5 (two-tailed Student's t-test).
Figure 3.
Figure 3.
Analysis of miR-122 targets at two time points ZT0 and ZT12. (A) Northern blot analysis of miR-122, let-7a, and tRNAThr of mice treated with miR-122 ASO, miR-124 ASO, or PBS. Pools of RNA of three mice were loaded per lane. (B) Quantification of Northern blot shown in A. (C) qPCR analysis of RNAs from individual mice treated with the ASOs or PBS, as indicated. Probes used were for the known miR-122 targets glycogen synthase 1 and aldolase A, normalized to 45S pre-rRNA. Values are mean ± SEM (n = 3). (D) Heat map of the probe sets up- and down-regulated in 122ASO-treated animals relative to both control groups, 124ASO- and PBS-treated animals (cutoff 1.5). The heat scale at the bottom of the panel represents changes on a linear scale, where green and red represent minimal and maximal expression, respectively. (E) Enrichment for circadian transcripts in the up- and down-regulated fractions in 122ASO mice. P-values were determined by a χ2 test.
Figure 4.
Figure 4.
Circadian genes are miR-122 targets. (A) Heat map of the circadian probe sets (left and middle panel; taken from Kornmann et al. 2007b) that are up-regulated in 122ASO mice (right panel). Smarcd1/Baf60a was just below the stringent criteria used for circadian expression in the microarray data of Kornmann et al. (2007b), but was also included in the figure as it was confirmed as robustly circadian by qPCR (see Fig. 5). Heat scales at the bottom of the panels represent changes on a linear scale with green and red representing minimal and maximal expression, respectively. Transcripts in bold type contain potential miR-122 seed sites in their 3′UTRs. (B) The effect of miR-122 mimics in a 3′UTR luciferase assay. Control has only the vector 3′UTR, containing no seed sites. 3xbulge and Cat-1/hsSlc7a1 are positive controls for 3′UTRs known to be regulated by miR-122. Values are mean ± SEM (n ≥ 6 per transfection). (*) P < 10−2; (**) P < 10−3; (***) P < 10−4 (two-tailed Student's t-test). (C) qPCR analysis in 122ASO mice and PBS controls of pre-mRNA (top panels) and mRNA (bottom panels) levels of selected transcripts from A. Hist1h1c is an intron-less gene; hence, pre-mRNA levels were not measured. Note that Ccnd1 is also changed on the pre-mRNA level and is hence probably up-regulated by an indirect, transcriptional effect. Data are mean values of three mice per condition ±SEM. (*) P < 10−2 (two-tailed Student's t-test).
Figure 5.
Figure 5.
miR-122 targets in 122ASO and Rev-erbα knockout mice around the clock. (A) pre-mRNA (top panels) and mRNA (bottom panels) levels for the indicated transcripts in 122ASO and PBS-injected control mice around the clock. For each data point, transcript levels were measured in triplicate by qPCR using a pool of total liver RNA isolated from three to four mice. Due to low abundance, the detection of pre-mRNA levels was less robust, as indicated by generally larger error bars (standard deviations) in the qPCR analysis. (B) As in A, pre-mRNA (top panels) and mRNA (bottom panels) levels measured around the clock in Rev-erbα knockout and wild-type littermate animals, using a pool of whole-cell liver RNA isolated from five female mice.
Figure 6.
Figure 6.
Cross-talk between miR-122 and PPAR receptors. (A) The effect of the miR-122 mimic in a 3′UTR luciferase assay as in Fig. 4B, using the Pparβ/δ and Smarcd1/Baf60a 3′UTRs. Values are mean ± SEM (n ≥ 9 per transfection). (***) P < 10−5 (two-tailed Student's t-test). (B) Expression levels of Pparβ/δ mRNA quantified from Northern blots. Data are mean ± SEM (n = 3 animals per condition). (C) Immunoprecipitation-Western blot of PPARβ/δ protein from 122ASO and PBS-treated mice, as described in the Materials and Methods. Each immunoprecipitation was performed from a pool of extracts from three mice. U2AF65 protein levels in the input of the same pool served as a loading control. (D) FFA levels in liver pieces from 122ASO- and PBS-injected animals, as determined by GC/MS. Values are mean ± SEM (n = 6). (*) P < 0.05 (two-tailed Student's t-test).
Figure 7.
Figure 7.
Models for how miR-122 could impart on circadian gene expression of its targets. (A) Even constant miR-122 levels (dark gray) could shape the circadian rhythm of a target (light gray) by constantly repressing basal levels of translation (represented by the overlap of the two areas). Only the amount of target mRNA represented by the dotted area would be available for translation into protein. As shown in the cartoon, this mechanism could increase the amplitude of cycling and convert a low-amplitude mRNA rhythm into a higher amplitude protein rhythm. In addition, this regulation could confer robustness to low protein expression levels in the trough, as described in the Discussion. The mechanism depicted in this cartoon would require a high affinity of the miRNA–target interaction and an excess of targets over the miRNA. Considering that miR-122 probably has hundreds of targets, of which many contain several seed sites, this assumption is quite plausible even for this highly abundant miRNA (B) Conceivably, chemically distinct, short-lived miR-122 subpopulations (dark gray) could exist within the pool of bulk miR-122. If these distinct miR-122 species also had specific functional properties, this speculative model would imply that target mRNAs would be subject to circadian repression. Consequently, the transcript available to produce protein (dotted area) would show circadian oscillations. (C) Conceivably, newly assembled RISC complexes could immediately get committed to their target mRNAs and remain stably associated with them, as described in the Discussion. The availability of such newly assembled miR-122 RISC would be expected to closely follow circadian miR-122 production (dark gray). If targets are transcribed circadianly as well, the phase relationship of the two rhythmic processes will determine to what extent a target will encounter miR-122 RISCs in the cell, and what influence this has on the circadian amplitude, magnitude, and phase of the produced protein (dotted area). As in A, this model would demand that the miRISC–mRNA affinity be high and that the targets are in excess. (D) Model for the integration of miR-122 in circadian hepatic gene expression. MiR-122 is depicted as a tissue-specific modulator of circadian output genes, with PPAR-dependent regulation of gene expression as one of the regulated output pathways.

Comment in

  • Liver "tick tock".
    Shackel NA. Shackel NA. Hepatology. 2009 Oct;50(4):1310-1. doi: 10.1002/hep.23266. Hepatology. 2009. PMID: 19790199 No abstract available.

References

    1. Baek D, Villen J, Shin C, Camargo FD, Gygi SP, Bartel DP. The impact of microRNAs on protein output. Nature. 2008;455:64–71. - PMC - PubMed
    1. Beitzinger M, Peters L, Zhu JY, Kremmer E, Meister G. Identification of human microRNA targets from isolated argonaute protein complexes. RNA Biol. 2007;4:76–84. - PubMed
    1. Bhattacharyya SN, Habermacher R, Martine U, Closs EI, Filipowicz W. Relief of microRNA-mediated translational repression in human cells subjected to stress. Cell. 2006;125:1111–1124. - PubMed
    1. Bushati N, Cohen SM. microRNA functions. Annu Rev Cell Dev Biol. 2007;23:175–205. - PubMed
    1. Chang J, Nicolas E, Marks D, Sander C, Lerro A, Buendia MA, Xu C, Mason WS, Moloshok T, Bort R, et al. miR-122, a mammalian liver-specific microRNA, is processed from hcr mRNA and may downregulate the high affinity cationic amino acid transporter CAT-1. RNA Biol. 2004;1:106–113. - PubMed

Publication types

Substances