. 2009 Jun 1;23(11):1327-37.
doi: 10.1101/gad.1777409.

The PTEN-regulating microRNA miR-26a is amplified in high-grade glioma and facilitates gliomagenesis in vivo

Affiliations

The PTEN-regulating microRNA miR-26a is amplified in high-grade glioma and facilitates gliomagenesis in vivo

Jason T Huse et al. Genes Dev. .

Abstract

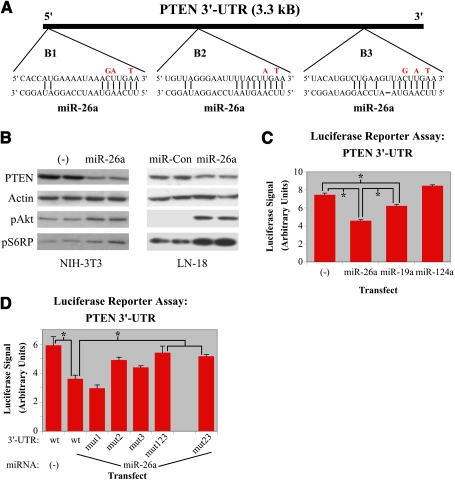
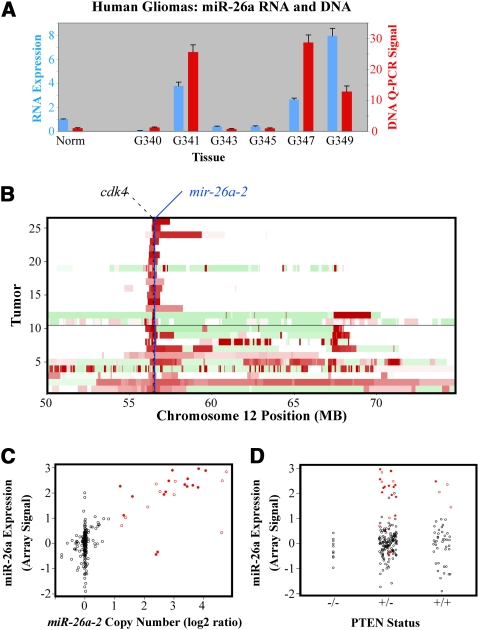
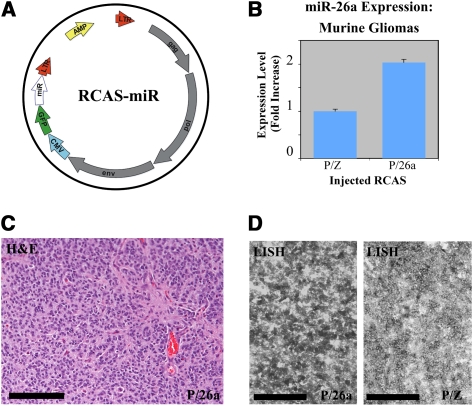
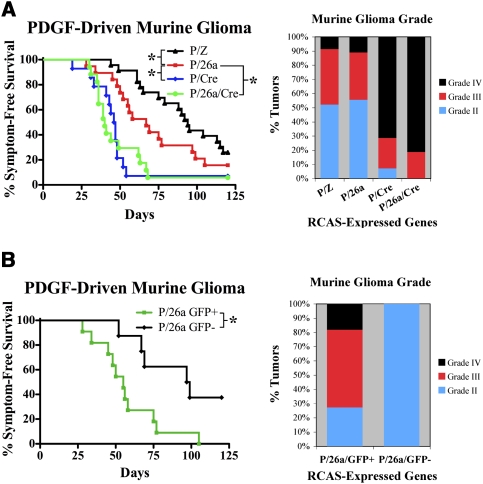
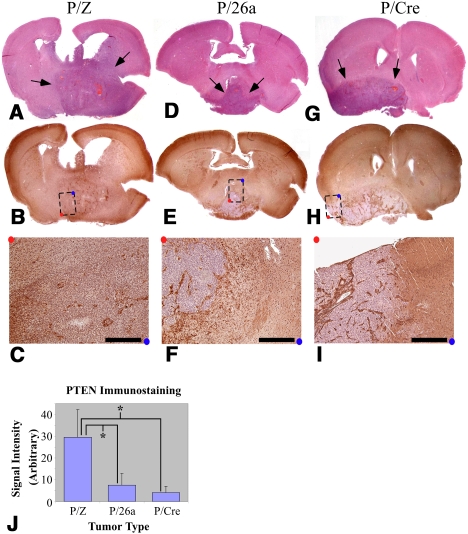
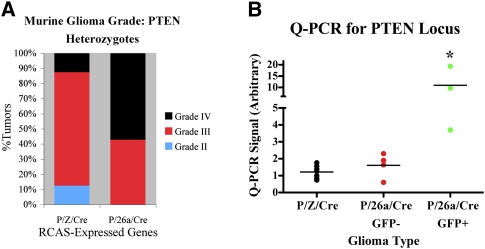
Activated oncogenic signaling is central to the development of nearly all forms of cancer, including the most common class of primary brain tumor, glioma. Research over the last two decades has revealed the particular importance of the Akt pathway, and its molecular antagonist PTEN (phosphatase and tensin homolog), in the process of gliomagenesis. Recent studies have also demonstrated that microRNAs (miRNAs) may be responsible for the modulation of cancer-implicated genes in tumors. Here we report the identification miR-26a as a direct regulator of PTEN expression. We also show that miR-26a is frequently amplified at the DNA level in human glioma, most often in association with monoallelic PTEN loss. Finally, we demonstrate that miR-26a-mediated PTEN repression in a murine glioma model both enhances de novo tumor formation and precludes loss of heterozygosity and the PTEN locus. Our results document a new epigenetic mechanism for PTEN regulation in glioma and further highlight dysregulation of Akt signaling as crucial to the development of these tumors.


Figures

Figure 1.
Figure 1.
miR-26a directly targets PTEN. (A) Schematic of the PTEN 3′-UTR showing binding sites for miR-26a. Nucleotide changes for binding site mutants are indicated in red. (B) NIH-3T3 or human glioblastoma (LN-18) cells were retrovirally transduced with empty vector (−), miR-26a, or control miRNA (miR-Con). Western blots for PTEN, pAkt, pS6RP, and actin are shown. (C) miR-26a targets PTEN directly as measured by luciferase reporter assay. A luciferase reporter plasmid containing the PTEN 3′-UTR was transfected into HEK 293 cells along with miRNA-expressing constructs (transfected miR; n = 3 for each). Cells were lysed 24–48 h later, and luciferase activity was quantified. (D) Mutagenesis of the three potential miR-26a-binding sites in the PTEN 3′UTR either singly or in combination (M1, M2, M3, M123, M23) in the context of this assay demonstrated that sites B2 and B3 are functional. (*) P < 0.01.
Figure 2.
Figure 2.
miR-26a is amplified in glioma. (A) QRT–PCR and Q-PCR performed on total RNA and DNA extracted from human high-grade gliomas (G340–G349) and normal cerebral cortex (Norm). RNA (blue) and DNA (red) levels are expressed as fold increase relative to the normal control. (B) Schematic of TCGA data showing GBMs with amplification of the miR-26a-2 locus on chromosome 12q (n = 25 of 233). Each tumor corresponds to a horizontal bar across the chart. Red and green indicate copy number increases and decreases, respectively. The locations of miR-26a-2 and CDK4 are indicated by the blue line and the dashed black line, respectively. Tumors with chromosome 12 amplicons containing <30 genes (defined as focal in this study) are presented above the solid black line. (C) Schematic of TCGA data demonstrating that miR-26a overexpression (Y-axis) is almost invariably associated with miR-26a-2 amplification (X-axis). Array signal intensity for miR-26a is normalized to the mean of all samples (0 on Y-axis). (D) Schematic of TCGA data demonstrating the association of miR-26a overexpression (Y-axis) with PTEN status (X-axis). (C,D) Amplified tumors are indicated in red with focal amplifications indicated as solid red circles.
Figure 3.
Figure 3.
miR-26a-expressing murine gliomas (P/26a). (A) Schematic of RCAS-miR constructs; CMV denotes CMV promoter, GFP denotes GFP cassette, and miR denotes miRNA domain. (B) Overexpression of miR-26a was verified in lysates of crudely dissected tumors by QRT–PCR. (C,D) A grade III murine glioma with forced miR-26a expression. H&E staining (C) and LNA-in situ hybridization (LISH; D) for miR-26a are shown. (D) For the latter, a grade III tumor with no forced miR-26a expression (P/Z) is also shown (bars, 100 μm).
Figure 4.
Figure 4.
miR-26a facilitates gliomagenesis in vivo. (A) Kaplan-Meier curves demonstrating symptom-free survival for P/Z, P/26a, P/Cre, and P/26a/Cre mice (n = 23, 19, 14, and 17 respectively; [*] P < 0.05). The percentages of tumors exhibiting WHO grade II, grade III, and grade IV histological features are also shown for each genotype. (B) Kaplan-Meier curves demonstrating symptom-free survival for P/26a mice with and without detectable immunostaining for GFP reporter (n = 11 and 8 respectively; [*] P < 0.05). Histological grades for tumors in the P/26a GFP+ and P/26a GFP groups are also shown.
Figure 5.
Figure 5.
miR-26a represses PTEN expression in murine gliomas. Grade IV tumors from P/Z (AC), P/26a (DF), and P/Cre (GI) mice. H&E staining is shown in A, D, and G; immunostaining for PTEN is shown in B, C E, F, H, and I. C, F, and I are enlargements at 5× magnification of the regions designated in by dashed boxes in B, E, and H, respectively (bars, 400 μm). Arrows indicate tumors on H&E staining. Red and blue dots are orientation guides. (J) Quantification of PTEN immunostaining for two tumors in each genotype (see the Materials and Methods); units are arbitrary. (*) P < 0.05.
Figure 6.
Figure 6.
miR-26a overexpression precludes PTEN loss of heterozygosity in PDGF-driven PTEN+/− murine gliomas. P/Z/Cre and P/Z/26a gliomas were generated in Ntv-a/PTEN+/fl mice (n = 7 and 7, respectively). (A) P/Z/26a Ntv-a/PTEN+/fl mice exhibited more grade IV gliomas. (B) Additionally, genomic DNA was extracted from paraffin sections of all PTEN+/− tumors and analyzed for PTEN by Q-PCR. GFP+ P/26a/Cre tumors exhibited a significantly higher level of retained PTEN than GFP P/26a/Cre and P/Z/Cre tumors. (*) P < 0.05. Means are designated by horizontal lines.

Similar articles

Cited by

References

    1. Baehring JM. An update on oligodendroglial neoplasms. Curr Opin Neurol. 2005;18:639–644. - PubMed
    1. Baek D, Villen J, Shin C, Camargo FD, Gygi SP, Bartel DP. The impact of microRNAs on protein output. Nature. 2008;455:64–71. - PMC - PubMed
    1. Baeza N, Weller M, Yonekawa Y, Kleihues P, Ohgaki H. PTEN methylation and expression in glioblastomas. Acta Neuropathol. 2003;106:479–485. - PubMed
    1. Bartel DP. MicroRNAs: Target recognition and regulatory functions. Cell. 2009;136:215–233. - PMC - PubMed
    1. Becher OJ, Hambardzumyan D, Fomchenko EI, Momota H, Mainwaring L, Bleau AM, Katz AM, Edgar M, Kenney AM, Cordon-Cardo C, et al. Gli activity correlates with tumor grade in platelet-derived growth factor-induced gliomas. Cancer Res. 2008;68:2241–2249. - PubMed

Publication types