. 2009 Jun 16;106(24):9697-702.
doi: 10.1073/pnas.0901444106. Epub 2009 Jun 1.

Sorting in early endosomes reveals connections to docking- and fusion-associated factors

Affiliations

Sorting in early endosomes reveals connections to docking- and fusion-associated factors

Sina V Barysch et al. Proc Natl Acad Sci U S A. .

Abstract

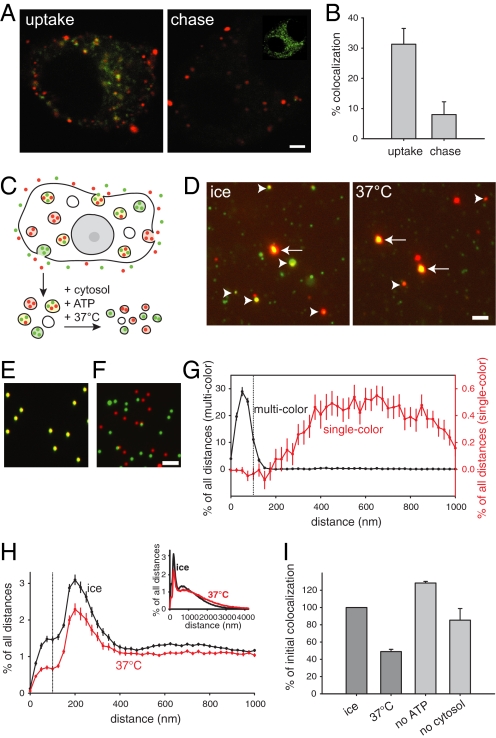
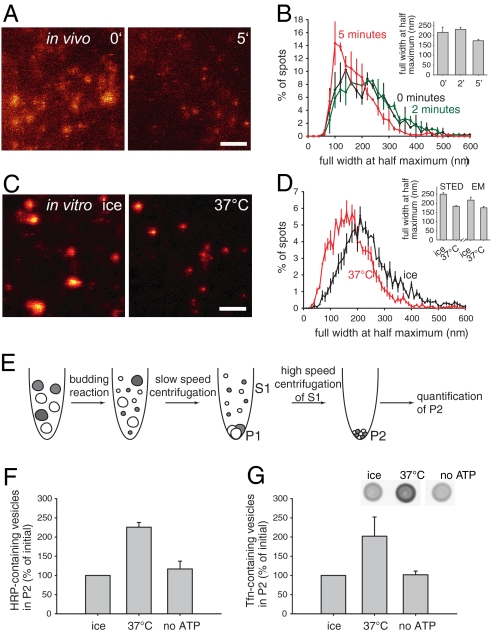
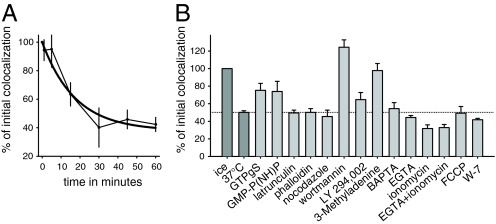
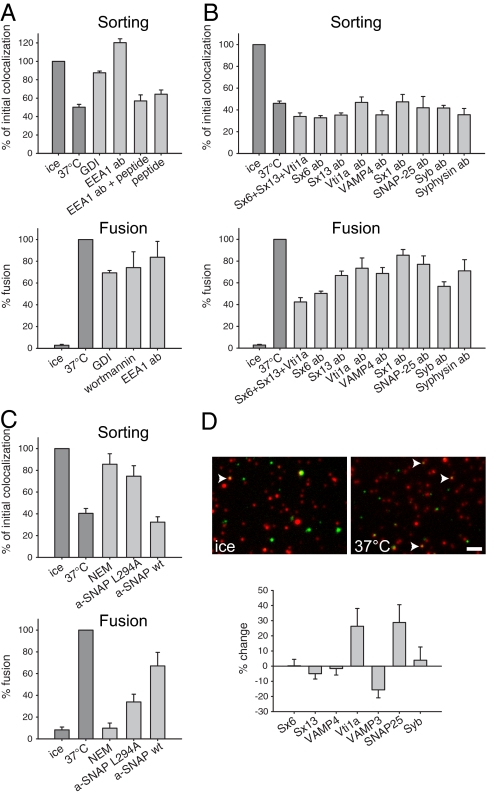
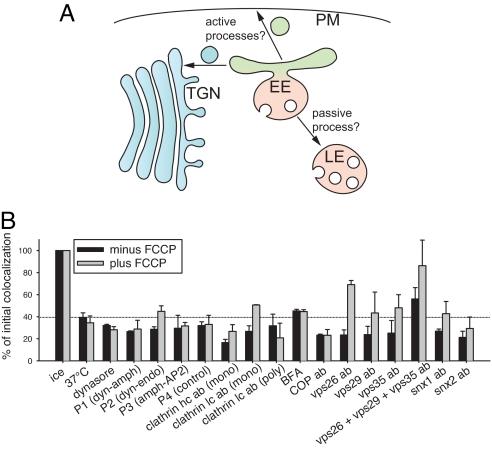
The early endosomes constitute a major sorting platform in eukaryotic cells. They receive material through fusion with endocytotic vesicles or with trafficking vesicles from the Golgi complex and later sort it into budding vesicles. While endosomal fusion is well understood, sorting is less characterized; the 2 processes are generally thought to be effected by different, unrelated machineries. We developed here a cell-free assay for sorting/budding from early endosomes, by taking advantage of their ability to segregate different cargoes (such as transferrin, cholera toxin subunit B, and low-density lipoprotein, LDL) into different carrier vesicles. Cargo separation required both carrier vesicle formation and active maturation of the endosomes. Sorting and budding were insensitive to reagents perturbing clathrin coats, coatomer protein complex-I (COPI) coats, dynamin, and actin, but were inhibited by anti-retromer subunit antibodies. In addition, the process required Rab-GTPases, phosphatidylinositol-3-phosphate, and, surprisingly, the docking factor early endosomal autoantigen 1 (EEA1). Sorting also required the function of the N-ethylmaleimide-sensitive factor (NSF), a well-known fusion cofactor, while it did not depend on preceding fusion of endosomes. We conclude that fusion, docking, and sorting/budding are interconnected at the molecular level.


Conflict of interest statement

The authors declare no conflict of interest.

Figures

Fig. 1.
Fig. 1.
The microscopic assay for early endosomal sorting. (A) Segregation of labeled cargo in vivo. PC12 cells were loaded simultaneously with transferrin (green) and LDL (red) for 5 min (Left). During a chase period of 30 min (Right), a substantial amount of the transferrin is released from the cells, thus clearly segregating from the LDL label, which remains trapped. However, some transferrin still persists within intracellular organelles (see inset; the chased cell is depicted with increased contrast). (B) Quantification of colocalization in vivo. Approximately 30% of the organelles were initially double labeled, decreasing to ≈8% after the chase. Bars show means ± SEM (n = 3). (C) Schematic overview of the in vitro sorting assay. PC12 cells are loaded simultaneously with labeled transferrin (green) and LDL (red), and postnuclear supernatant (PNS) is prepared. Incubation of the PNS in the presence of ATP and cytosol results in separation of the 2 labels due to budding. (D) Fluorescence images from samples incubated on ice (negative control) and samples incubated at 37 °C (positive control). Images acquired in the green (transferrin) and red (LDL) channels were aligned by using fluorescent beads (arrows) as a reference. Many endosomes appear initially (on ice) double labeled (yellow, arrowheads). After sorting, less colocalized (i.e., double-labeled) spots are visible. (Scale bar, 2 μm.) (E–G) Typical images from multicolored (E) or single-colored (F) fluorescent beads. Images acquired in the green and red channels were aligned (see SI Methods), intensity centers from all of the spots (beads) in both the green and red channels were calculated, and the distance from each spot to the closest one in the other channel was measured and plotted in a histogram (G). While the distance between single-colored objects never falls below about ≈200 nm, virtually all double-labeled beads have their green and red intensity centers within a 100-nm distance (vertical dotted line). The graph shows means ± SEM (n = 3). (H) The same measurements as in G were performed with transferrin- and LDL-containing early endosomes before (ice, black curve) and after (37 °C, red curve) the sorting reaction. The amount of double-labeled organelles (± SEM (n = 43). Note that, for clarity, the plot shows distances only up to 1000 nm (full-scale graph shown as inset). (I) Quantification of colocalization. We measured the percentage of organelles that have their green and red intensity centers within 100 nm. Colocalization decreases by 50% after the sorting reaction (initial colocalization refers to samples incubated on ice). Removal of ATP or omission of cytosol completely blocks this reaction. Bars show means ± SEM (n = 4).
Fig. 2.
Fig. 2.
In vitro sorting results in the formation of small transferrin-containing vesicles. (A) STED microscopy images of PC12 cells labeled with transferrin–Atto647N. Cells were allowed to bind and internalize transferrin for 15 min on ice. After washing the unbound transferrin, cells were chased for different time periods (0, 2, and 5 min) at 37 °C. After 5 min of chase, organelles appear smaller compared to the initial situation. (Scale bar, 1 μm.) (B) Size distribution of transferrin-containing endosomes in vivo as determined by STED microscopy. We measured the sizes from 600-1000 organelles per condition per experiment by taking line scans, fitting Lorentzian curves, and calculating the full width at half maximum (see SI Methods). A bar graph with the average sizes for each condition (inset) and a histogram with 20-nm bins show a decrease in the size of organelles after 5 min. Bars show means ± range of values (n = 2). (C) STED microscopy images of endosomes labeled with transferrin–Atto647N before (ice) and after the in vitro sorting reaction (37 °C). Endosomes appear initially much bigger than after the reaction. (Scale bar, 1 μm.) (D) Size distribution of transferrin-containing endosomes in vitro as determined by STED microscopy. We measured the sizes from 600-1000 organelles per condition per experiment as in B. A bar graph with the average sizes for each condition (inset) and a histogram with 10-nm bins show a decrease in the size of transferrin-containing organelles after the reaction. Bars show means ± SEM (n = 3). For comparison, the inset also shows the endosome size change in HRP-labeled endosomes, investigated by electron microscopy (means ± range of values, n = 2; see also Fig. S6). Note that the graph plots the full width at half maximum for the fluorescence data and the diameter for the electron microscopy data. (E) To investigate whether our in vitro sorting reaction results in budding of small vesicles, we established a biochemical budding assay (see schematic overview). A typical reaction was performed with HRP- or transferrin–Alexa 488-containing endosomes. To separate small vesicles from larger organelles, we performed a slow-speed centrifugation step. The supernatant containing the small vesicles was then subjected to a high-speed centrifugation, which ensured that we pelleted all remaining membranes in the pellet P2. The amount of newly formed small vesicles in P2 was then analyzed by an HRP-colorimetry reaction or by blotting for transferrin–Alexa 488 (see below). (F) Quantification of HRP-containing vesicles from P2 by a colorimetric ABTS reaction. Bars show means ± SEM (n = 6). (G) Quantification of small, transferrin–Alexa 488-containing vesicles from P2 by dot blots stained with antibodies against Alexa 488 (inset). Bars show means ± SEM (n = 4–5). Note that in both of the biochemical assays, the amount of small vesicles increases with budding, in an ATP-dependent manner.
Fig. 3.
Fig. 3.
Requirements of the sorting reaction. (A) Time course of the sorting reaction. The graph shows means ± range of values (n = 2–3); the solid line represents an exponential decay fit. (B) Effects of different reagents on early endosomal sorting of cargo: GTPγS (200 μM), GMP-P(NH)P (1 mM), latrunculin (15 μM), phalloidin (10 μM), nocodazole (20 μM), wortmannin (50 nM), LY 294,002 (100 μM), 3-Methyladenine (5 mM), BAPTA (10 mM), EGTA (10 mM), ionomycin (10 μM), FCCP (50 μM), and W-7 (100 μM) were added. The PI3K inhibitors block the reaction significantly. Bars show means ± SEM (n = 3–10).
Fig. 4.
Fig. 4.
Fusion/docking factors, but not the fusion step itself, are essential for sorting in early endosomes. (A) Sorting reactions (Upper) were performed as above. The indicated reagents were added (10 μM GDI, polyclonal antibodies against the N-terminal peptide of EEA1, 200 μM of antigenic peptides, and 50 nM wortmannin). In vitro fusion reactions (see SI Methods) were performed in parallel to check the effect of these reagents on the fusion (Lower). While GDI and the antibodies block cargo separation completely, they have only a minor effect on fusion. Bars show means ± SEM (n = 3–6 for sorting, n = 3 for fusion). (B) Addition of the recombinant cytosolic SNARE fragments syntaxin 6, syntaxin 13, and vti1a (30 μM each) or several polyclonal sera against SNAREs inhibits fusion efficiently (Lower) although they have no effect on cargo separation (Upper). Bars show means ± SEM (n = 3 for sorting and n = 4–5 for fusion). (C) Both N-ethylmaleimide (NEM, 2 mM) and the dominant-negative mutant of the NSF cofactor α-SNAP (L294A, 50 μM) block budding and fusion while the wild-type α-SNAP (50 μM) has no effect. Bars represent means ± SEM (n = 4–10 for sorting and n = 5–9 for fusion). (D) Immunostainings of transferrin–Alexa 488-containing organelles (green) before and after sorting. We centrifuged the endosomes onto coverslips and immunostained them with antibodies against vti1a (Upper) or syntaxin 6 (Sx6), syntaxin 13 (Sx13), VAMP4, VAMP3, synaptobrevin (Syb), and SNAP-25. Thirty percent to 70% of the organelles were positive for each of the SNAREs (data not shown). Arrowheads show colocalized organelles. Bars show the change in colocalization after budding for the respective SNAREs (means ± SEM, n = 3–6). (Scale bar, 2 μm.)
Fig. 5.
Fig. 5.
Carrier vesicle formation and endosome maturation in cargo sorting. (A) Hypothetic model of cargo separation. Early to late endosome maturation may be either a passive or an active process, while cargo vesicle formation can only be seen as active. (B) Effects of different reagents on early endosomal sorting of cargo, both in the absence (black bars) and in the presence (gray bars) of 50 μM FCCP, using triple-labeled endosomes as in Fig. S9. The following reagents were used: dynasore (80 μM), peptides (1 mM for P1 and P2 and 100 μM for P3 and P4), brefeldin A (360 μM), and antibodies (1:16) were added. Bars show means from 2–3 independent experiments (±SEM; when only 2 experiments were performed, the range of values is shown instead).

References

    1. Mills IG, Jones AT, Clague MJ. Regulation of endosome fusion. Mol Membr Biol. 1999;16:73–79. - PubMed
    1. Jahn R, Lang T, Sudhof TC. Membrane fusion. Cell. 2003;112:519–533. - PubMed
    1. Gruenberg J, Howell KE. Membrane traffic in endocytosis: Insights from cell-free assays. Annu Rev Cell Biol. 1989;5:453–481. - PubMed
    1. Brandhorst D, et al. Homotypic fusion of early endosomes: SNAREs do not determine fusion specificity. Proc Natl Acad Sci USA. 2006;103:2701–2706. - PMC - PubMed
    1. Stoorvogel W, Oorschot V, Geuze HJ. A novel class of clathrin-coated vesicles budding from endosomes. J Cell Biol. 1996;132:21–33. - PMC - PubMed

Publication types

LinkOut - more resources